U.S. Equity Strategy Updates
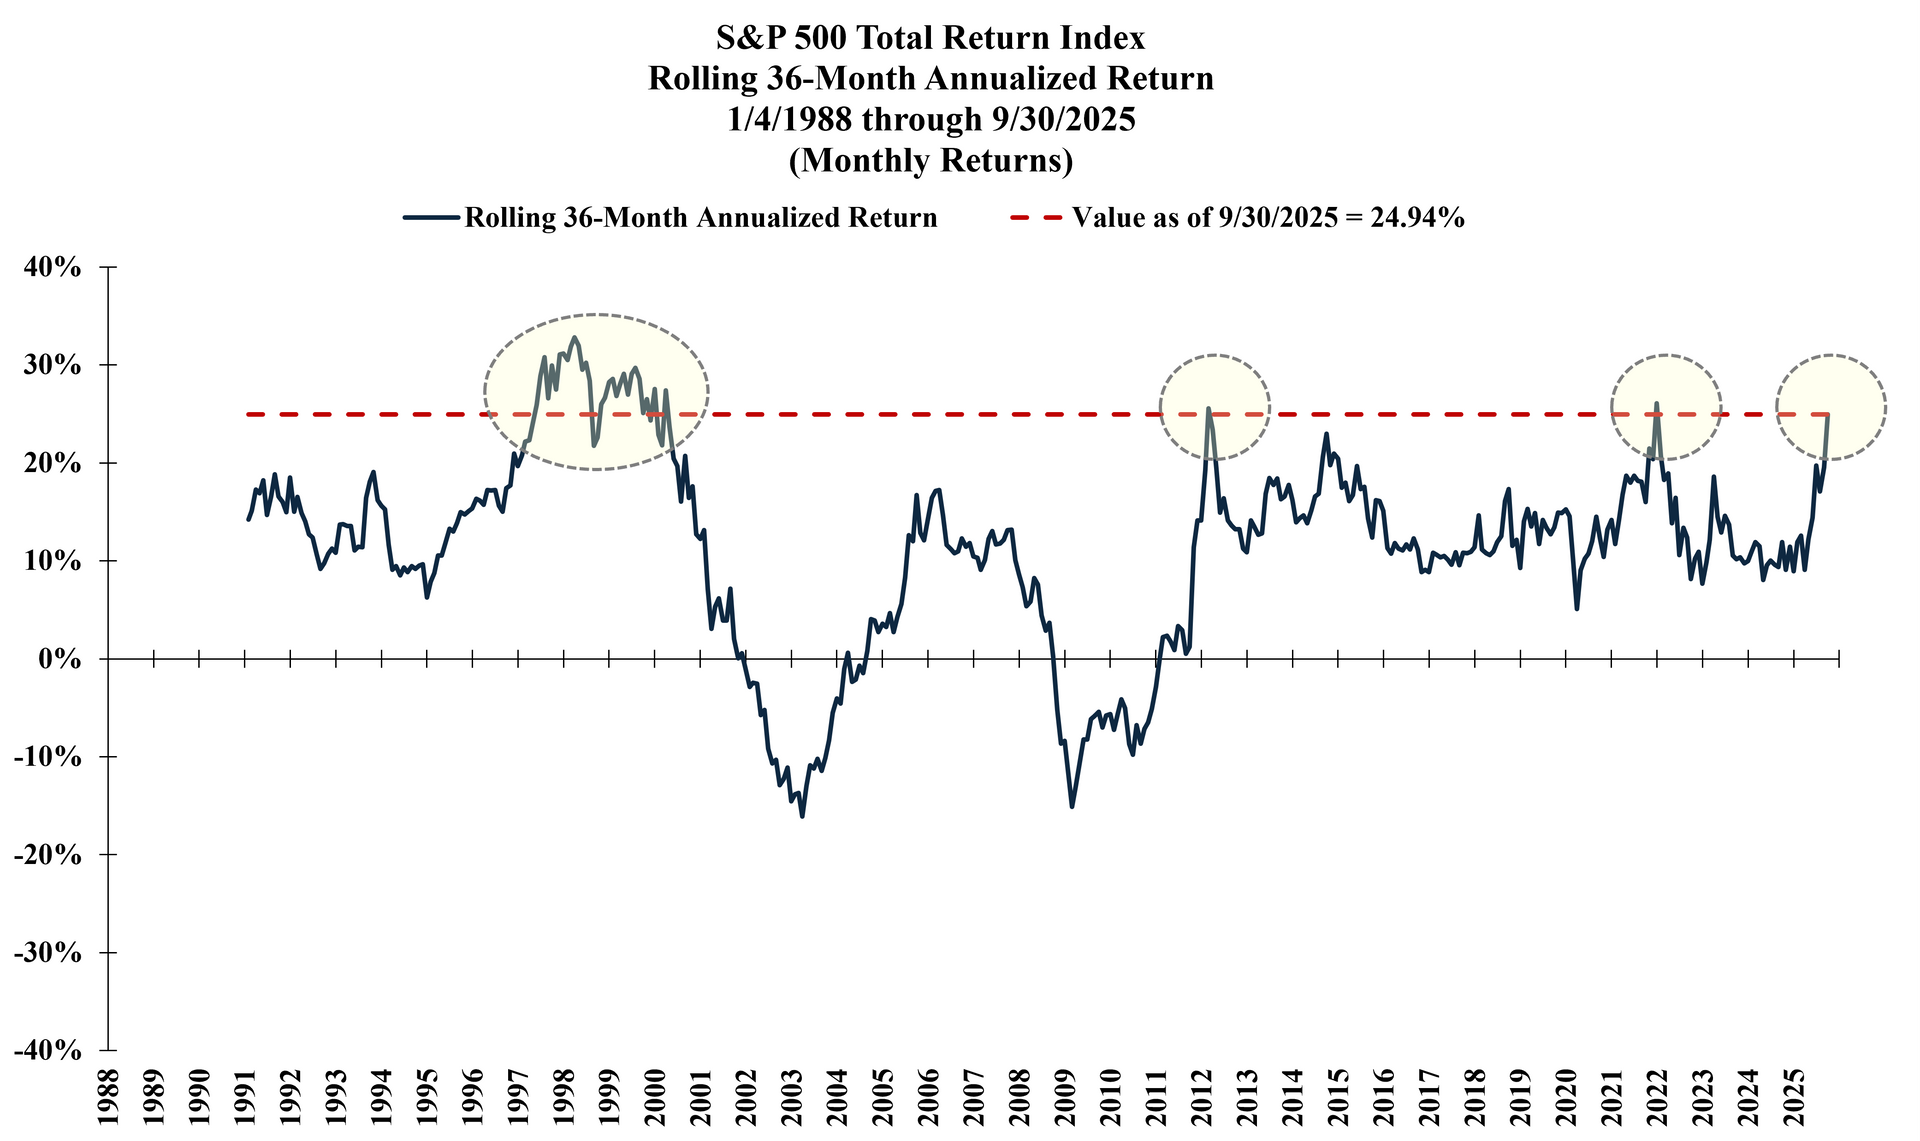
Last month we discussed the market’s seasonal tendency for weakness in September. The market convincingly bucked that trend this year and reached a notable performance threshold on a longer-term basis...
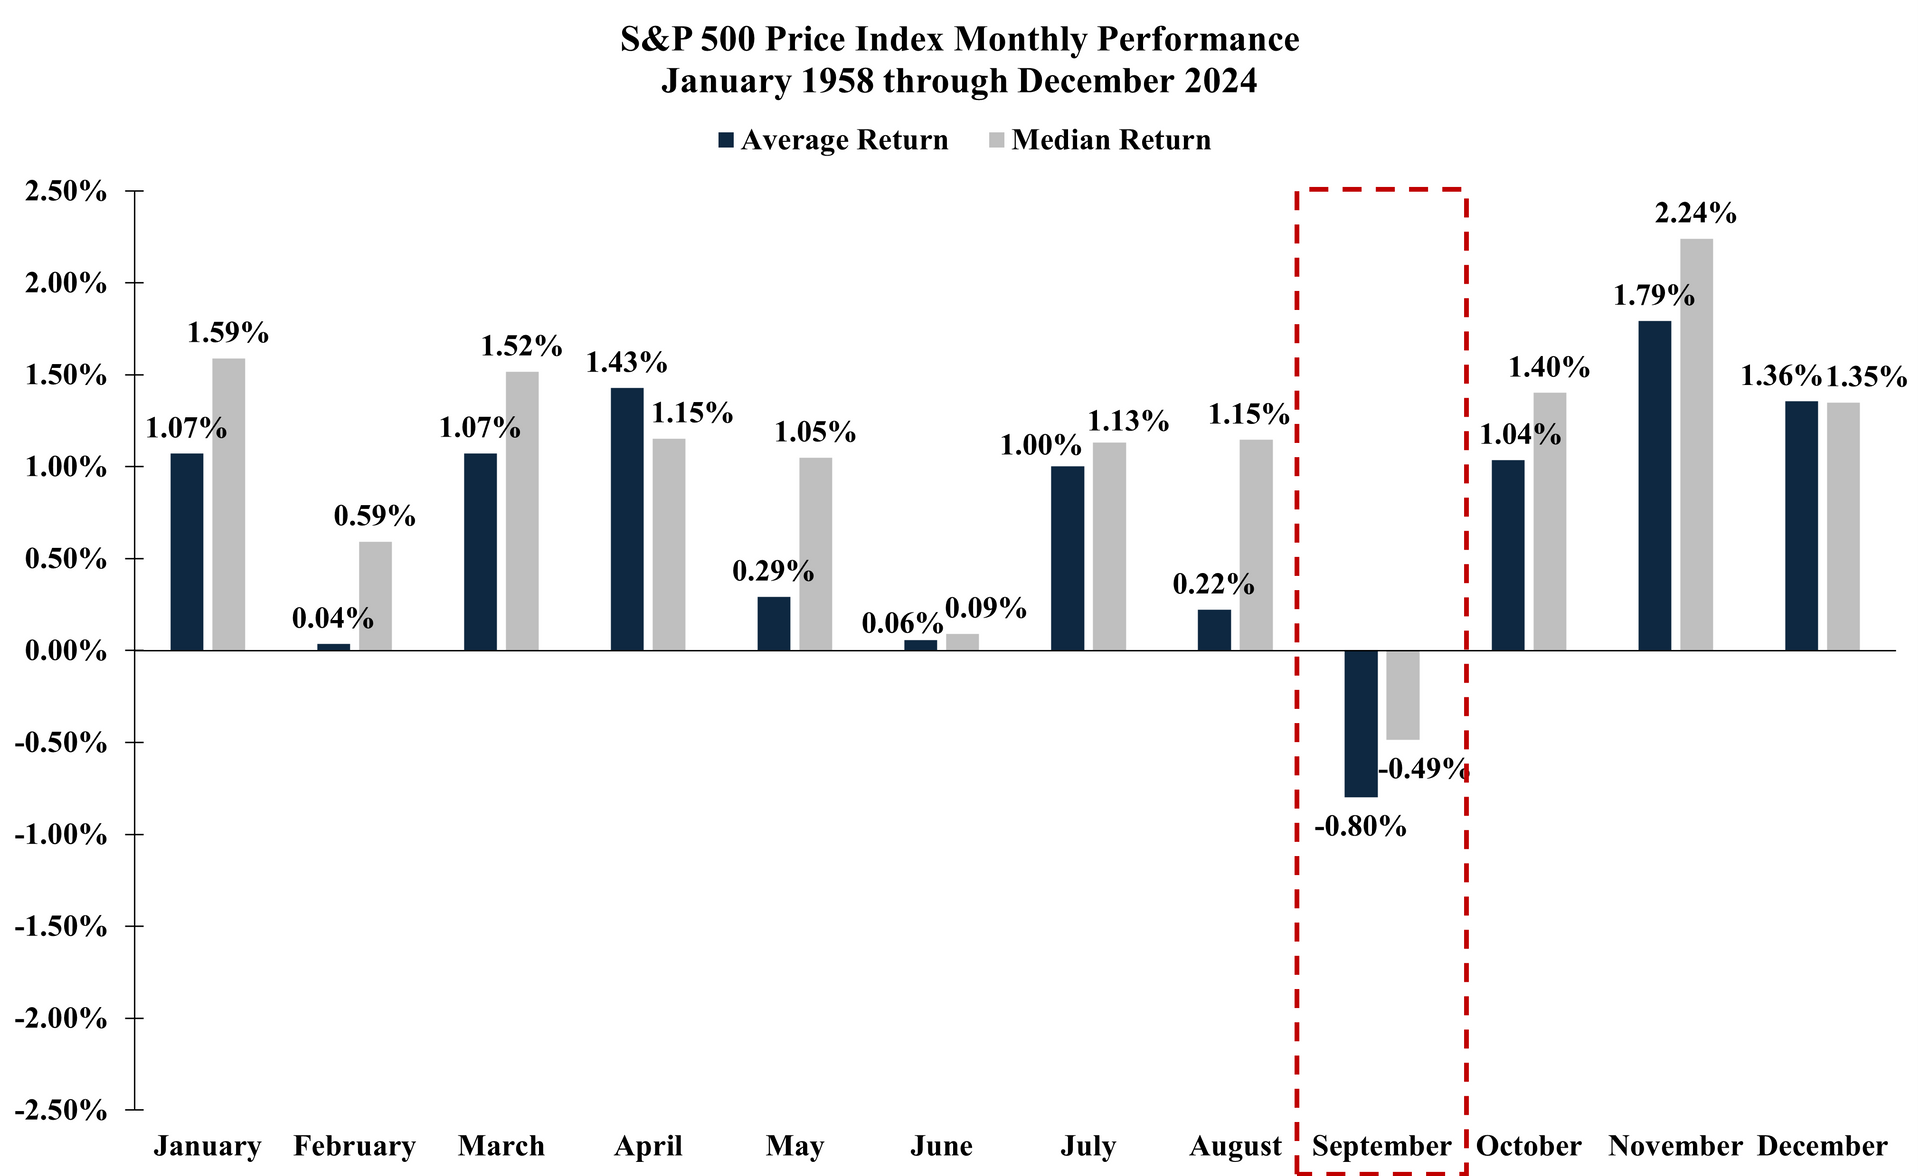
Many markets across asset classes can demonstrate seasonality to their historical performance, and the U.S. equity market is no exception. While the summer months typically deliver a favorable return profile, September has certainly earned its reputation as the least favorable month of the year for U.S. equities...
Many investors have likely heard some version of the market adage “The trend is your friend until the end when it bends.” The U.S. equity market stayed true to this notion and continued its rally through July as...
The powerful equity rally continued through June as the S&P 500 Total Return Index returned +5.09% for the month and has now returned +6.20% year-to-date. After reallocating to 33% S&P 500 exposure and 67% T-Bills exposure in mid-May, the MarketVector™-GammaRoad U.S. Equity Strategy Index...
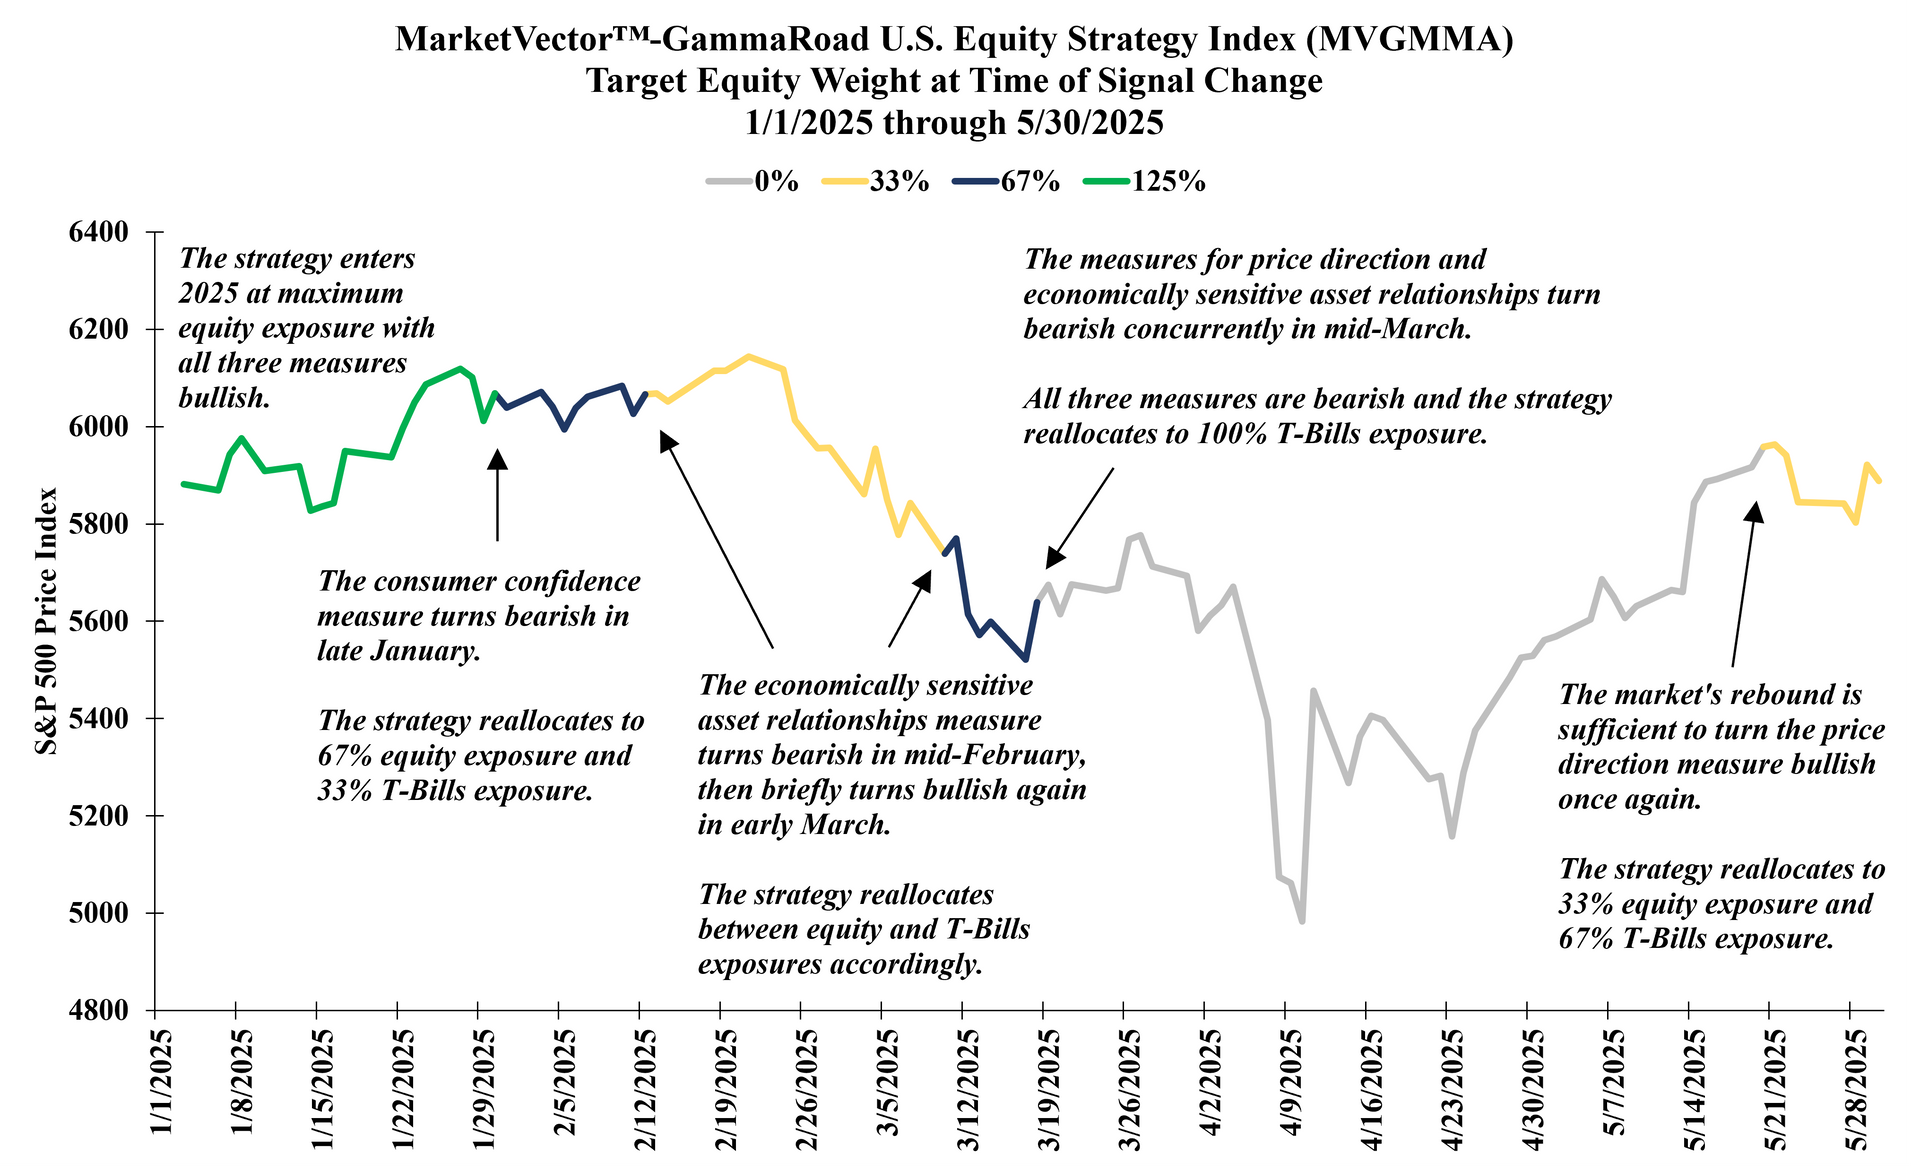
What a difference one month can make. The market’s impressive rally from the April lows continued through May, as the S&P 500 Total Return Index returned +6.29% for the month. This brought the market’s year-to-date return at +1.06% back into positive territory for the first time since January. The MarketVector™-GammaRoad U.S. Equity Strategy Index (Bloomberg: MVGMMA Index) held 100% T-Bills exposure through mid-May, until the market’s rally was sufficient to turn the strategy’s price trend measure bullish once again. As a result, the strategy reallocated to...
The S&P 500 Total Return Index fell modestly in April, although it likely did not feel anything like “modest” for equity investors. The market swiftly plummeted -11.19% through the first 6 market days of the month, before staging an impressive rally to finish down -0.68% for April and down -4.92% year-to-date. The MarketVector™-GammaRoad U.S. Equity Strategy Index (Bloomberg: MVGMMA Index) maintained its 100% T-Bills exposure throughout April and returned +0.34% for the month and +1.18% year-to-date. The primary question on many investors’ minds might be...
This has been quite a start to 2025, and this year is already providing an excellent opportunity for The MarketVector™-GammaRoad U.S. Equity Strategy Index (Bloomberg: MVGMMA Index) to demonstrate its value and potential to navigate significant changes in market conditions. The S&P 500 Total Return Index experienced its second consecutive down month in March and fell by -5.63%. The MarketVector™-GammaRoad U.S. Equity Strategy Index benefitted from entering March at roughly 33% equity exposure and 67% T-Bills exposure. During the month...
The MarketVector™-GammaRoad U.S. Equity Strategy Index (Bloomberg: MVGMMA Index) reduced its equity exposure for the second time since the start of the year, as its measure for economically sensitive asset relationships turned bearish during the second week of February. As a result, the strategy further lowered its equity weighting to 33% and increased its T-Bills exposure to 67%. The strategy returned -0.05% for February and provided valuable risk mitigation relative to the S&P 500 Total Return Index, which fell by -1.30% for the month. Year-to-date through February the MVGMMA Index...
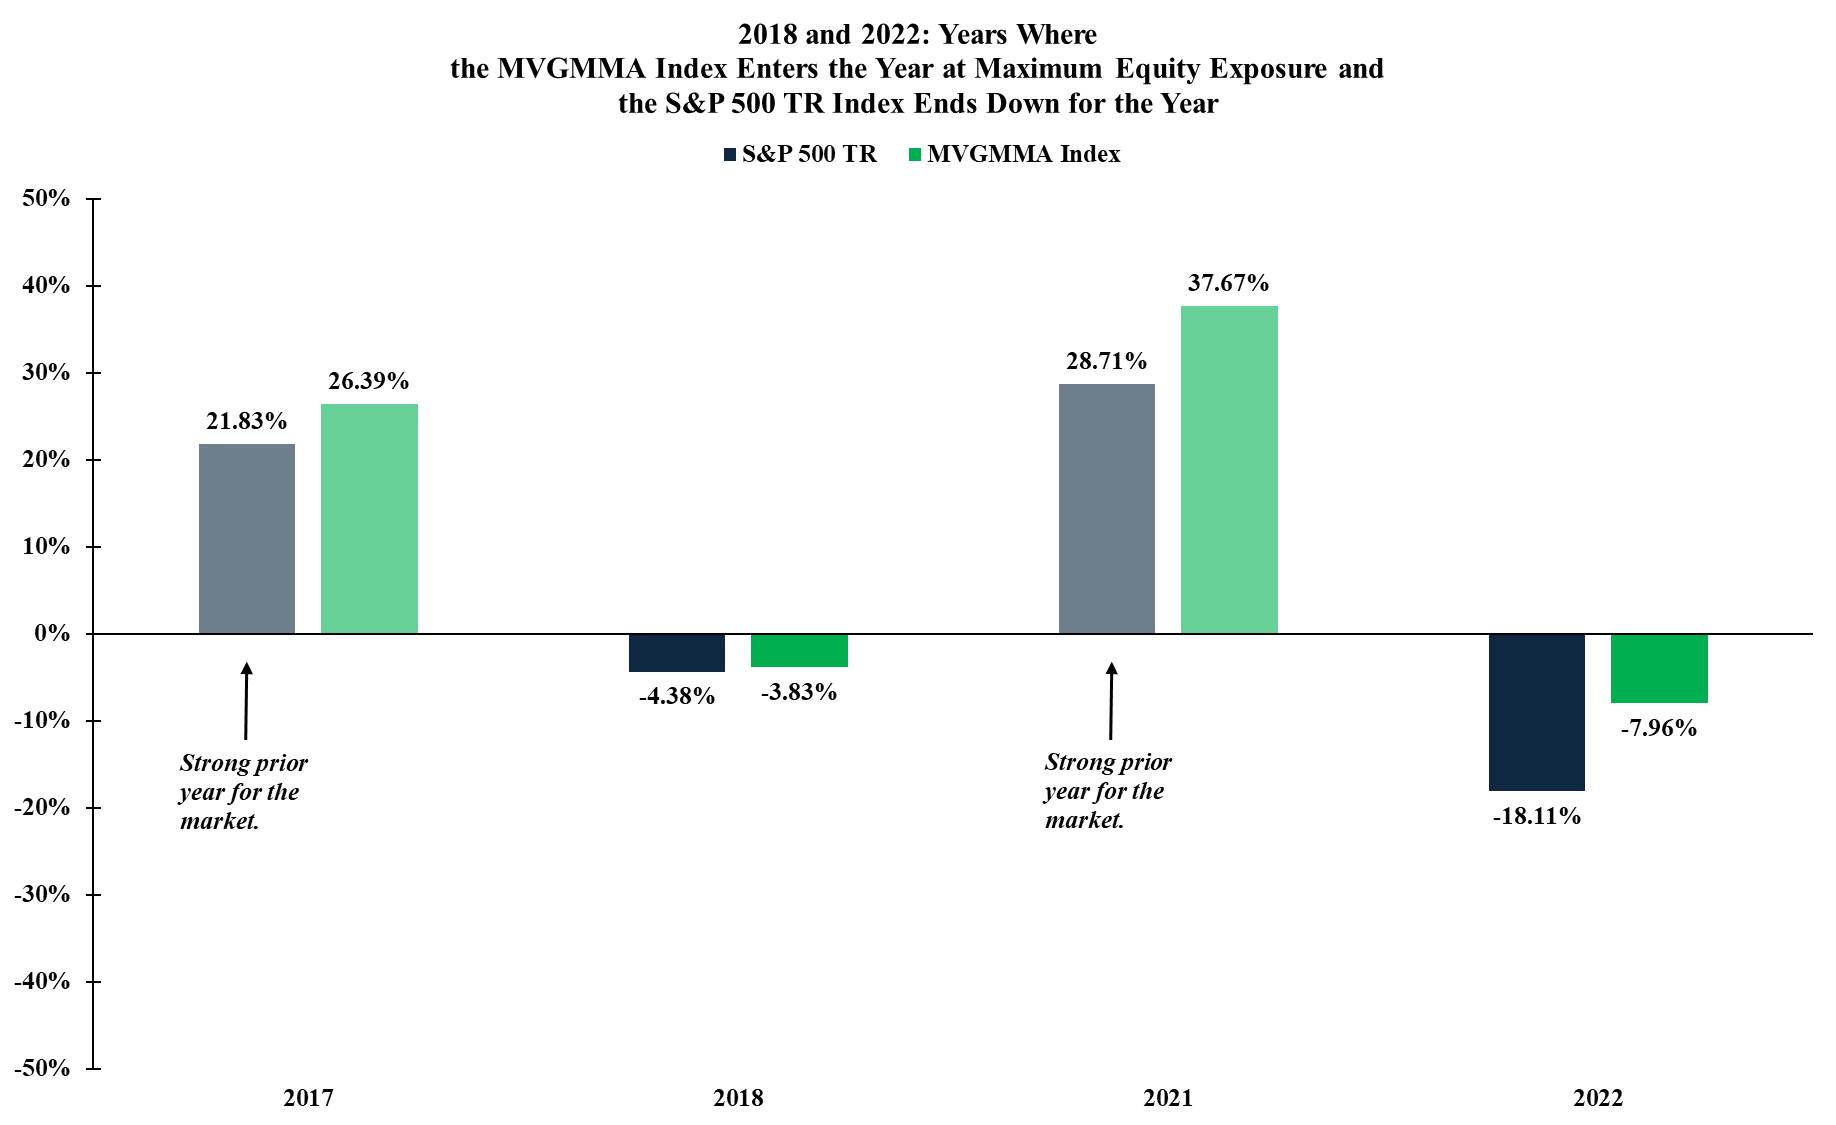
The market continued its impressive run in January, as the S&P 500 Total Return Index rose by +2.78% for the month. The MarketVector™-GammaRoad U.S. Equity Strategy Index (Bloomberg: MVGMMA Index) benefitted by entering 2025 at its maximum equity exposure and returned +3.23% to start the year. Notably, the strategy’s measure for consumer confidence turned bearish during the final week of January...
To follow-up on our focus from last month’s update, the market entered December in rarified territory based on its lofty performance over the prior 12 months. The S&P 500 Total Return Index took a breather by falling -2.38% for the month, while still recording an impressive +25.02% for the full year. As previously noted, the MarketVector™-GammaRoad U.S. Equity Strategy Index (Bloomberg: MVGMMA Index)...