U.S. Equity Strategy
Summary and Objectives
- The strategy seeks to achieve comparable total returns to the S&P 500 Index over the long term with significantly less risk.
- The strategy systematically evaluates three key risk measures: consumer confidence, economically sensitive asset relationships, and price direction.
- The strategy calculates a binary value for each measure as either favorable or unfavorable for market risk, and then combines these values to determine the target level of market exposure at the time of a signal change.
- The risk allocation process equally weights each measure and does not include any predictive components.
- The investment process is designed to adapt to the weight of evidence by gradually increasing or decreasing market exposure over time.
Investment Philosophy
- The buy-and-hold approach to owning equity requires the ability and willingness to live through substantial drawdowns in market value from time to time.
- This calls for an increase in risk tolerance as an investor approaches retirement age, and even more so when investors are required to withdraw from and depend on their retirement account for living expenses.
- History demonstrates that systematic avoidance of the most significant drawdowns can greatly improve longer term outcomes and financial security.
- Our framework measures three key market influences and aims to quantify how favorable the current environment is for taking equity risk.
Investment Process
The strategy systematically evaluates three key risk drivers for the equity market:
- Consumer confidence (measured monthly)
- Economically sensitive asset relationships (measured daily)
- Price direction (measured weekly)
By design the strategy incorporates three distinct, equal-weighted dimensions of risk over varying time horizons. This construction seeks to deliver a robust, adaptive approach to market risk as the environment evolves.
The strategy calculates a binary value for each risk driver at their respective time intervals. The calculated value is treated as either favorable or unfavorable for market risk, i.e. each driver’s value is either ‘1’ or ‘0’ at any point in time.
The strategy then aggregates these three values to determine the target level of market exposure whenever the aggregated value changes.
When all three measures are bearish, the strategy holds 100% T-Bill exposure. At the time when all three measures turn bullish, the strategy will reallocate to 125% equity exposure. If the measures are mixed, the strategy holds a combination of equity and T-Bill exposures.
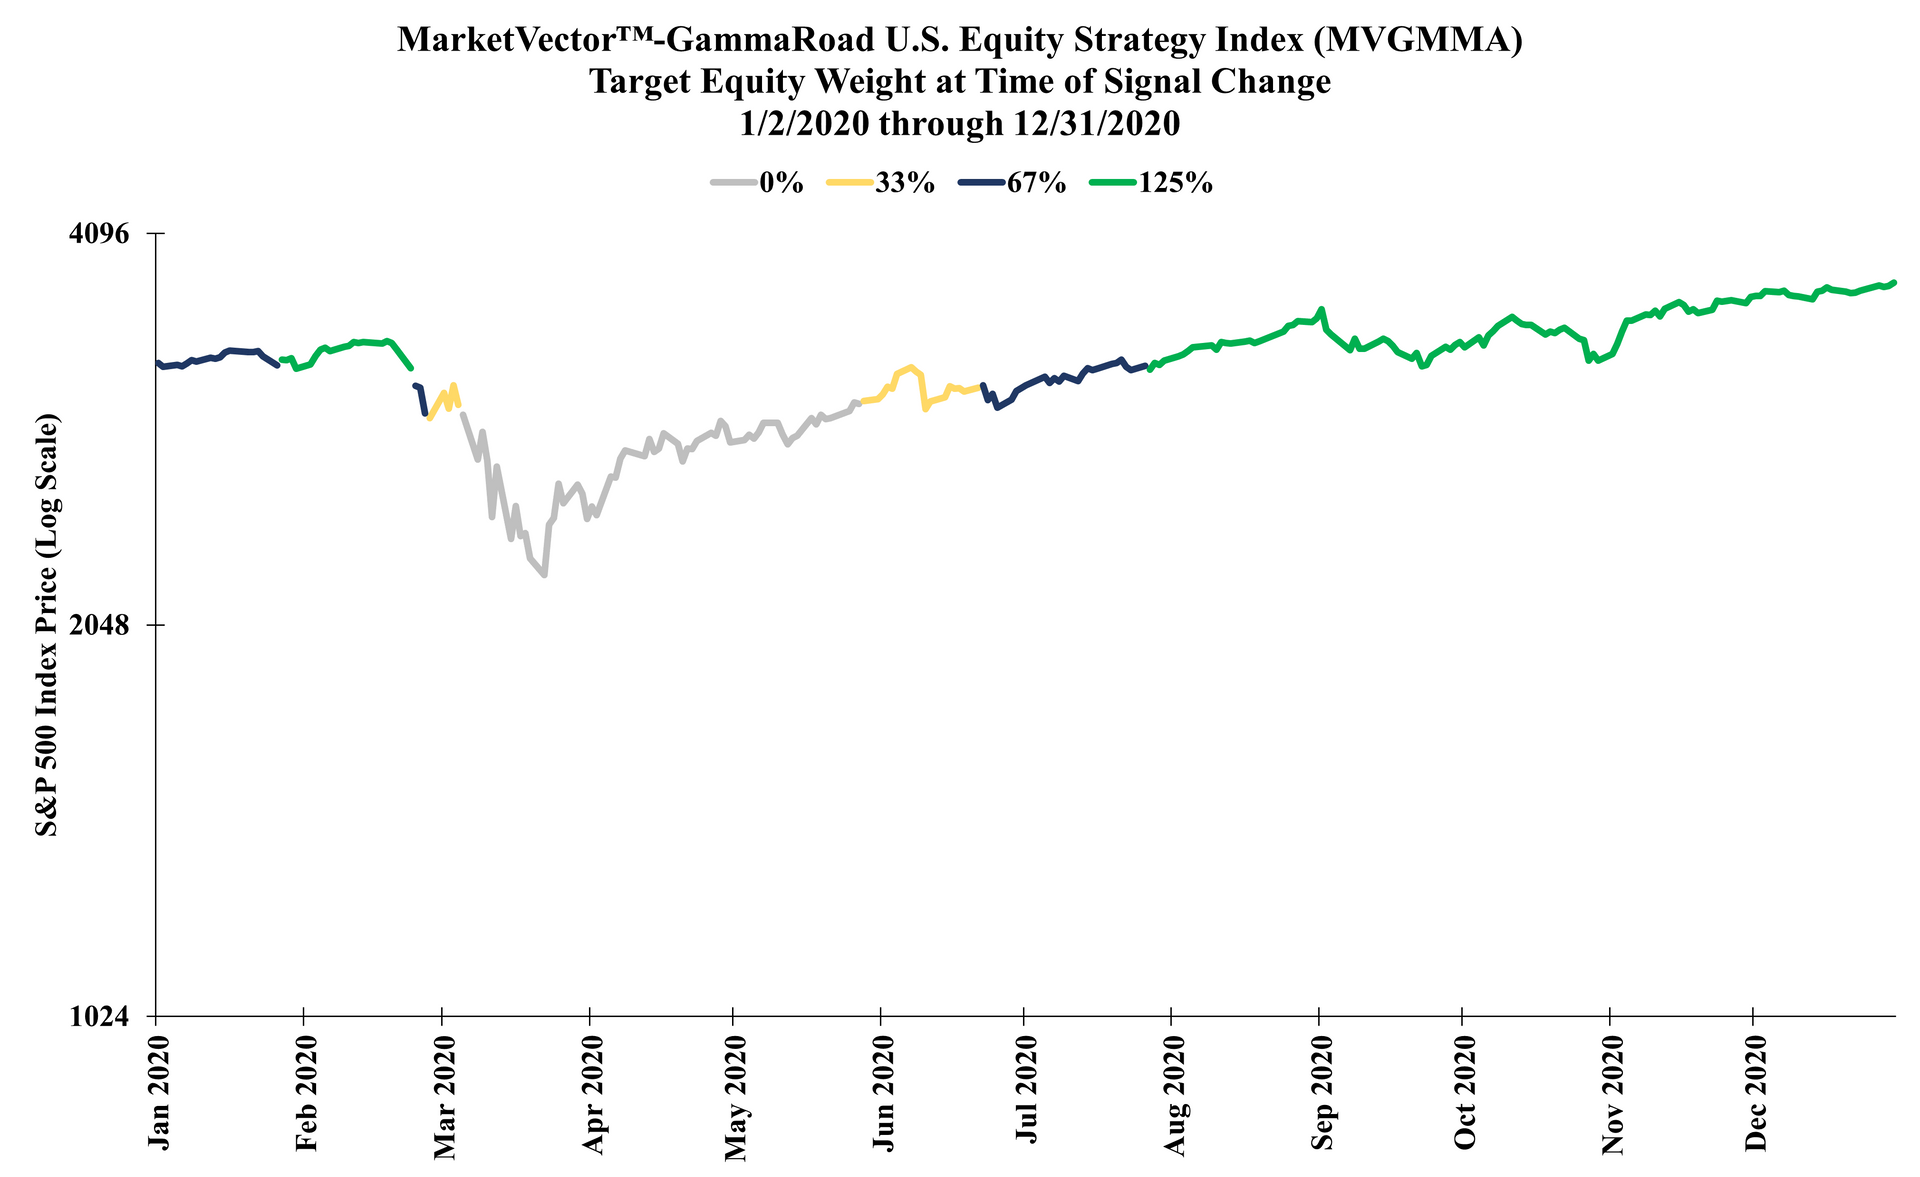
Here is how the allocation process looks over time since the base date of the MarketVector™-GammaRoad U.S. Equity Strategy Index.
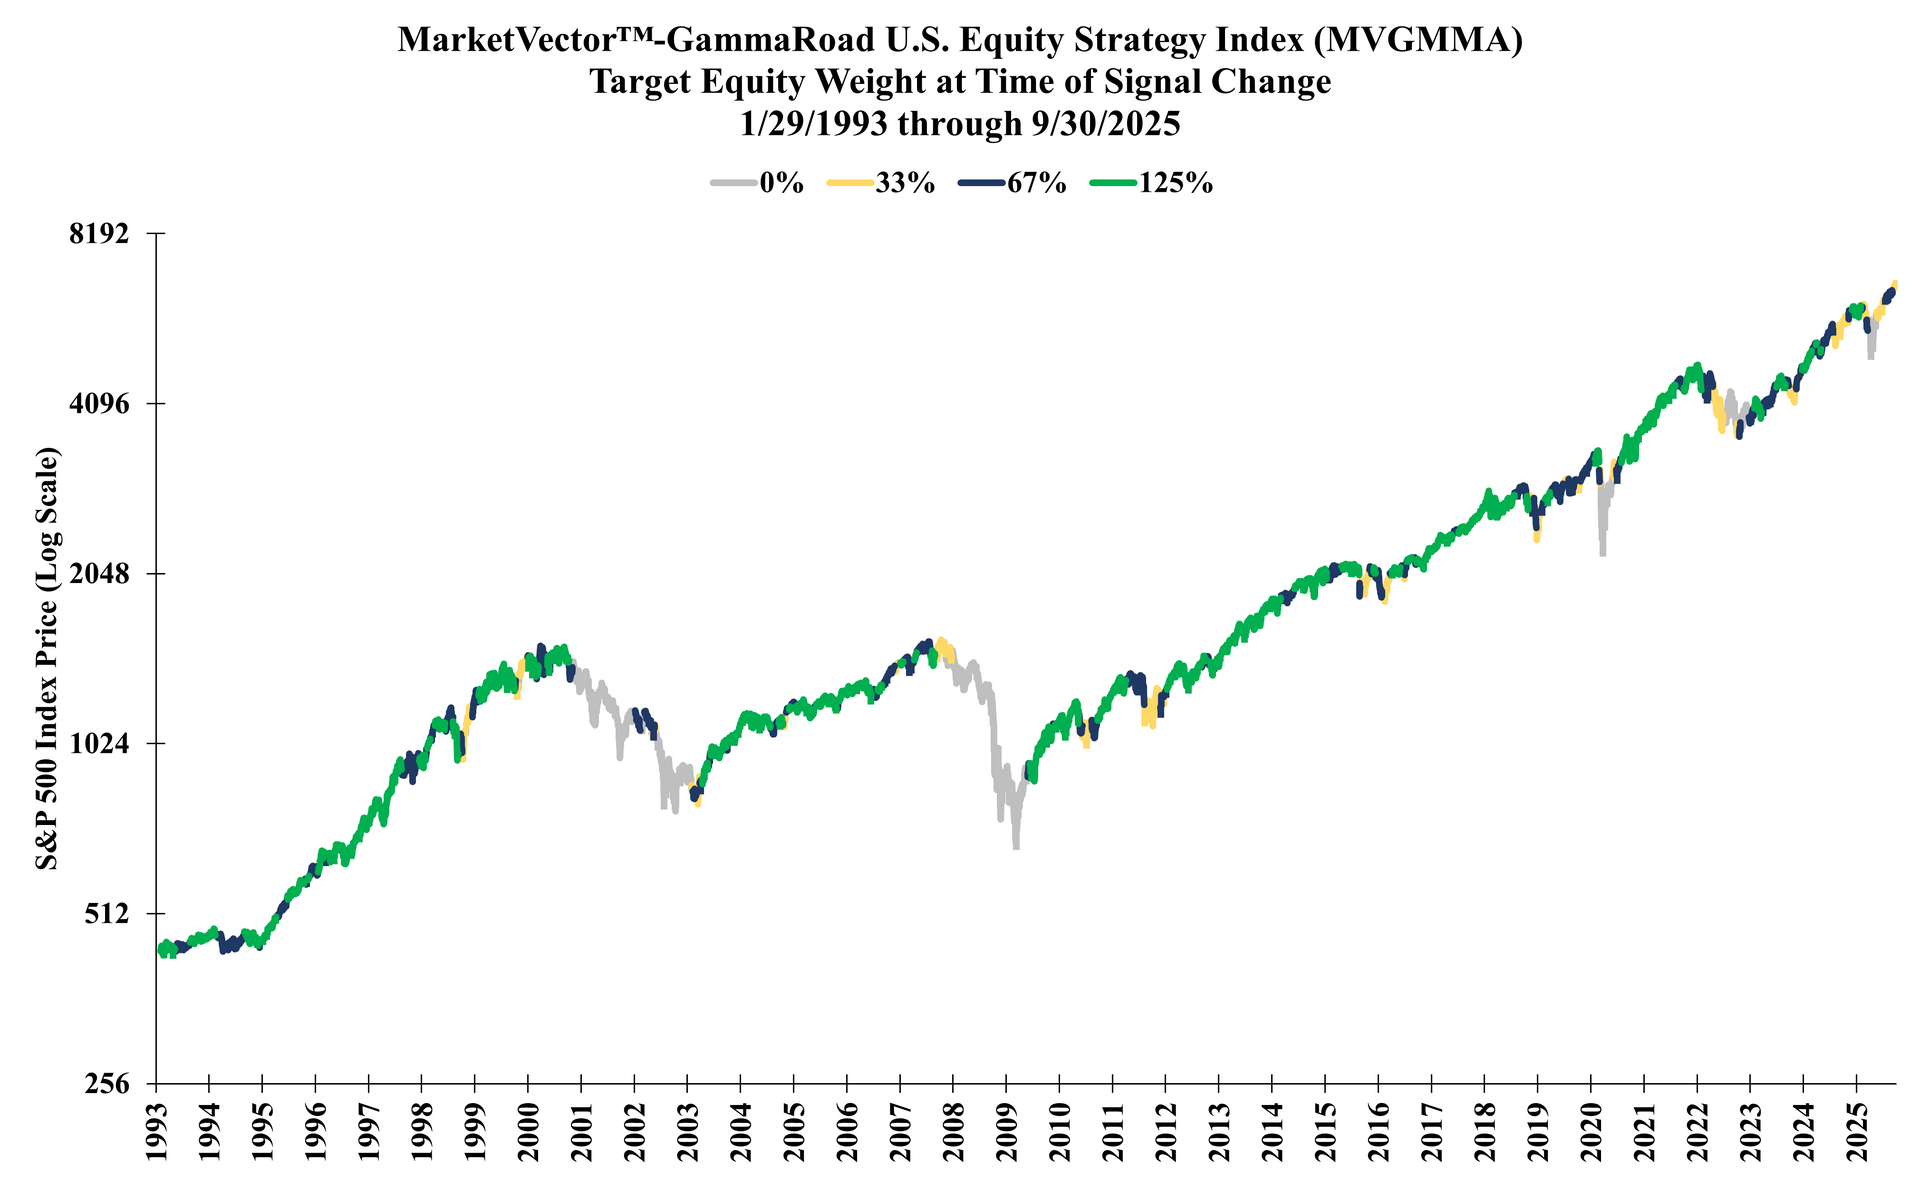
Source: GammaRoad Capital Partners, LLC. The S&P 500 Index is shown here on the y-axis to illustrate the index price level as the MarketVector™-GammaRoad U.S. Equity Strategy Index (Bloomberg: MVGMMA Index) target equity weight changes over time. The MVGMMA Index launched on December 22, 2023. Prior to December 22, 2023, the above target equity weight changes reflect backtested information based on the application of the MVGMMA Index methodology to the S&P 500 Index price data during periods when the MVGMMA Index was not actually published.
Please see the
important disclosures that are integral to understanding the limitations applicable to the quantitative information in the presentation.
Consumer Confidence
Consumer sentiment has proven to be a consistent barometer for equity risk appetite over many decades.
We view this as an intuitive relationship. When U.S. consumers experience increasing confidence, they are inclined to spend more, to hire more, and to expand or start new businesses.
During periods where U.S. consumers experience decreasing confidence, they are inclined to become more conservative with these decisions and more risk averse overall.
Our measure of consumer sentiment utilizes an independently published, survey-based index and quantifies the gradual rate of change as the index value updates each month.
A change in measurement to “Low and Rising” sentiment has historically indicated a transition to a more favorable environment for equity exposure, while a change in measurement to “High and Falling” sentiment has indicated a weakening condition for the market.
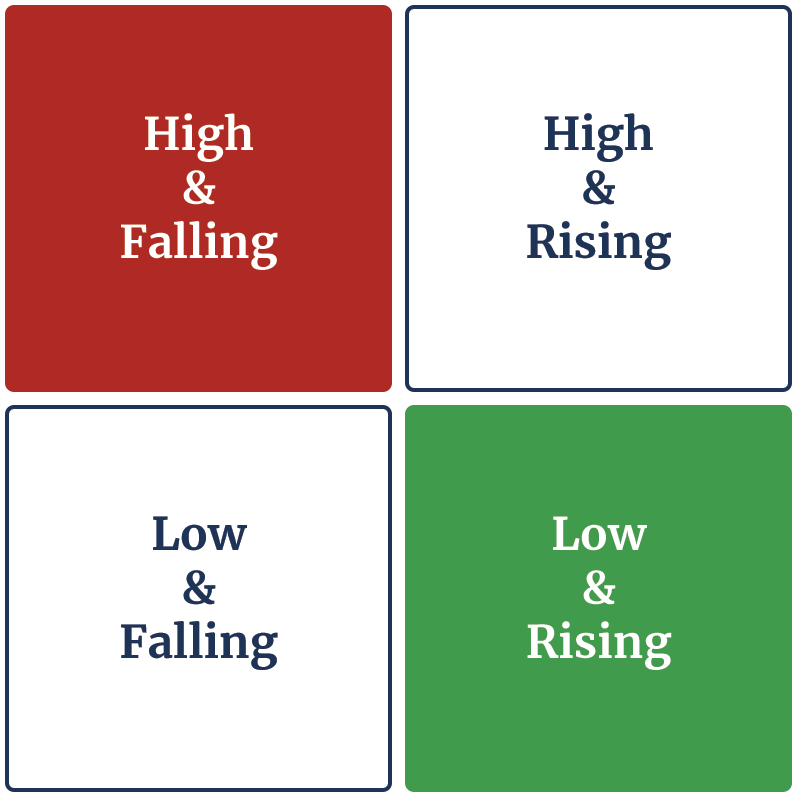
A simplified illustration of how we categorize sentiment.
Economically Sensitive Asset Relationships
Economically sensitive commodities, such as lumber and copper, often experience tightening supply/demand dynamics during periods of economic strength. This fundamental behavior can be observed within the more cyclical sectors, e.g. housing and construction, automobiles, industrials, and often indicates upswings in the growth cycle.
By contrast, gold often reflects sentiment around economic uncertainty and risk aversion. While gold can be a controversial asset among market participants, we maintain an unbiased view of gold, as we do with all assets and economic relationships throughout our entire process.
Our method of measuring the relative price dynamics between these commodities provides evidence as to how favorable the market environment is for equity risk.
Specifically, we have observed that periods where economically sensitive commodities outperform gold tend to indicate underlying strength in economic fundamentals and a supportive environment for equity exposure.
However, when gold outperforms these assets, it can be indicative of weakening economic growth and increasing uncertainty for equity investors.
Price Direction
Are we in a bull market or a bear market? Regardless of how an investor might answer this question, bull markets are characterized by rising prices and bear markets are characterized by falling prices.
Many conventional measures of price direction do an adequate job of identifying the prevailing trend, and we find that these measures tend to have certain trade-offs in common.
For example, measures that incorporate only the most recent prices will be highly sensitive to potential changes in trend, yet this benefit comes at the expense of frequent false signals, i.e. whipsaws that initially suggest a change in direction but ultimately result in a “head fake” and resumption of the prevailing trend.
Conversely, utilizing measures that incorporate a longer window of price history will reduce the frequency of false signals and the associated transaction costs, yet this comes at the expense of a much slower reaction time and therefore more potential loss at major turning points.
Many measures also incorporate the closing price as their only input. We find that this significantly ignores valuable structural information provided by the open, high, and low prices from the same periods.
We have constructed our measure in a manner that we believe balances these costs and benefits, while also including structurally valuable data beyond just the closing price.
The objective is not to pick tops and bottoms in the market. Rather the goal is to measure whether equity investors currently face headwinds or tailwinds based on decades of empirical evidence.
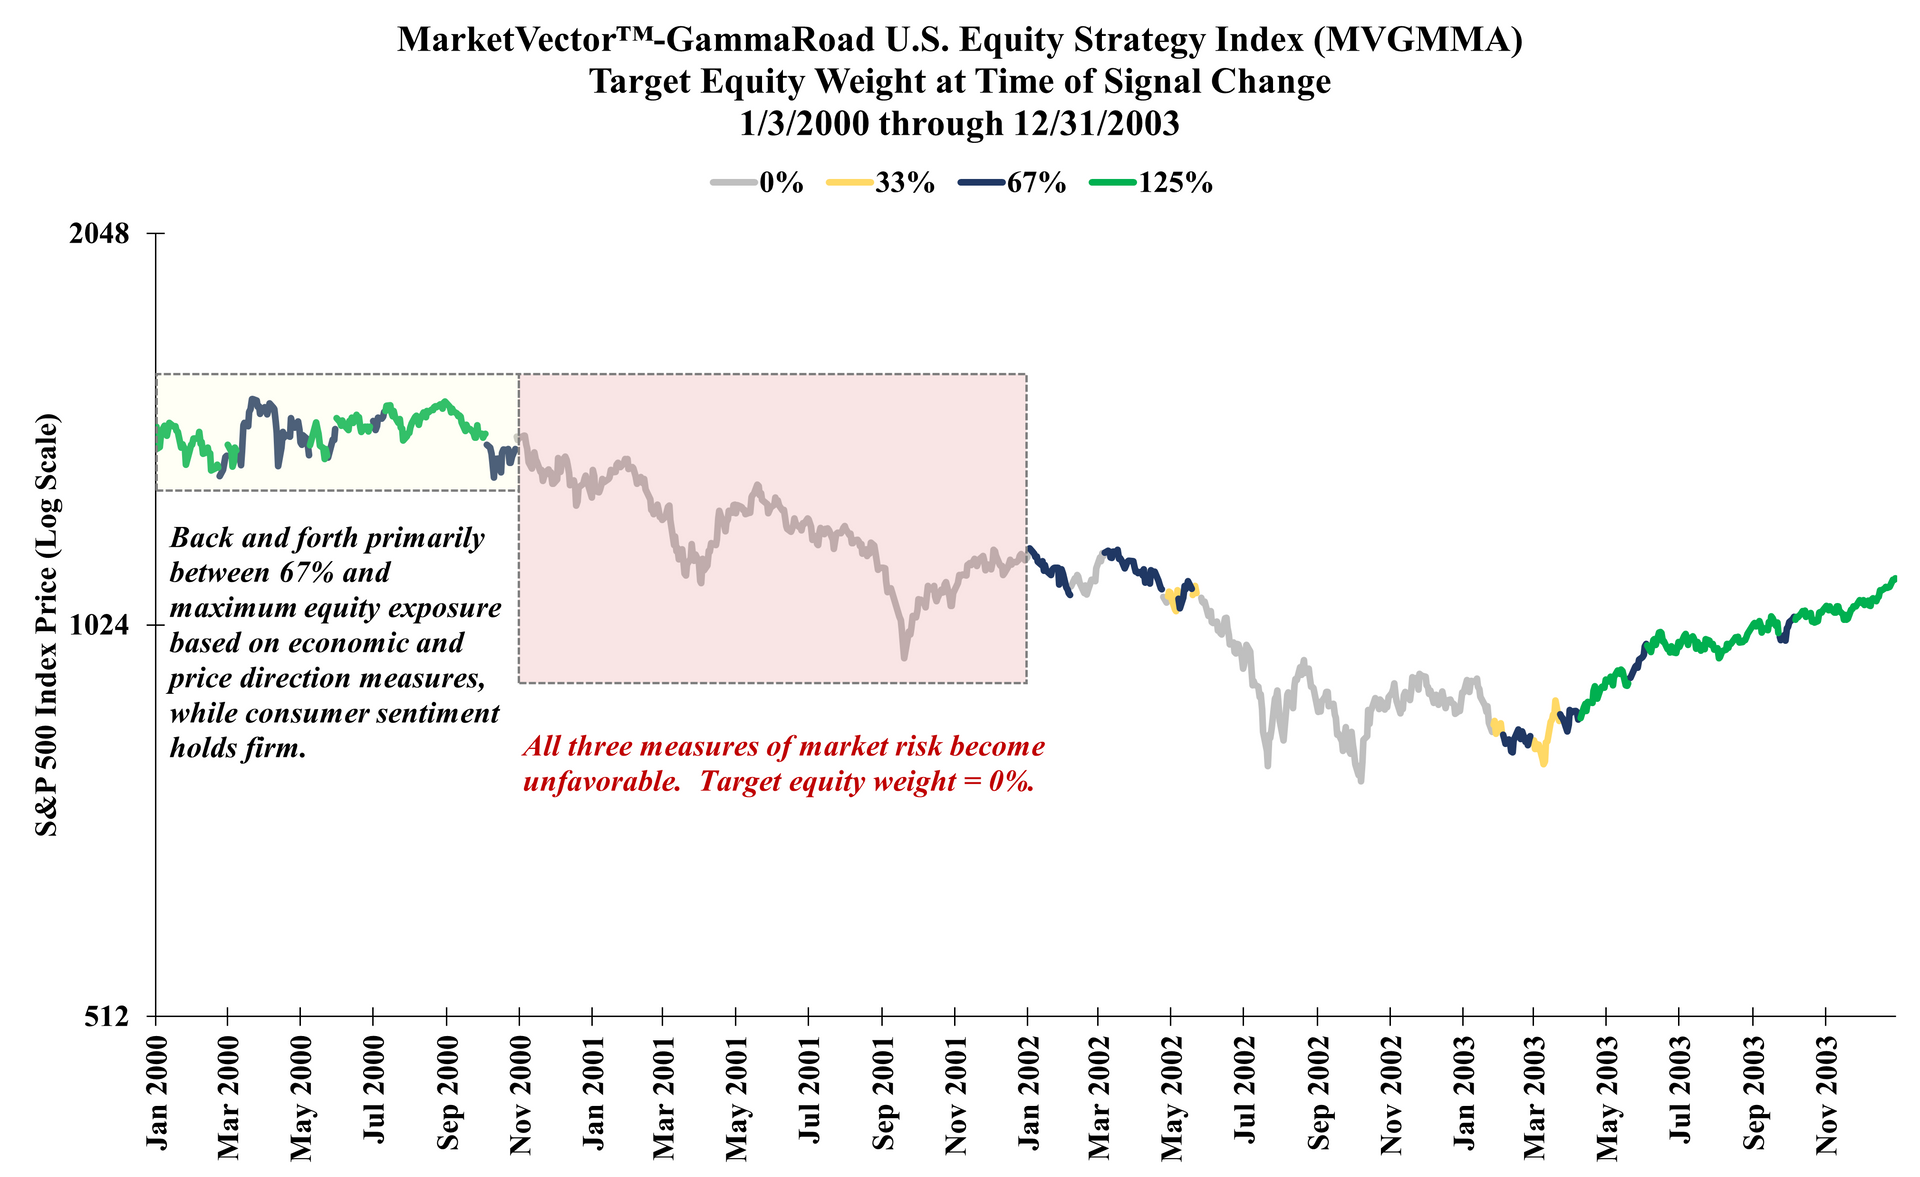
Risk Reduction During Notable Periods
We see consistent behavior in how our system can respond to increasingly adverse market environments.
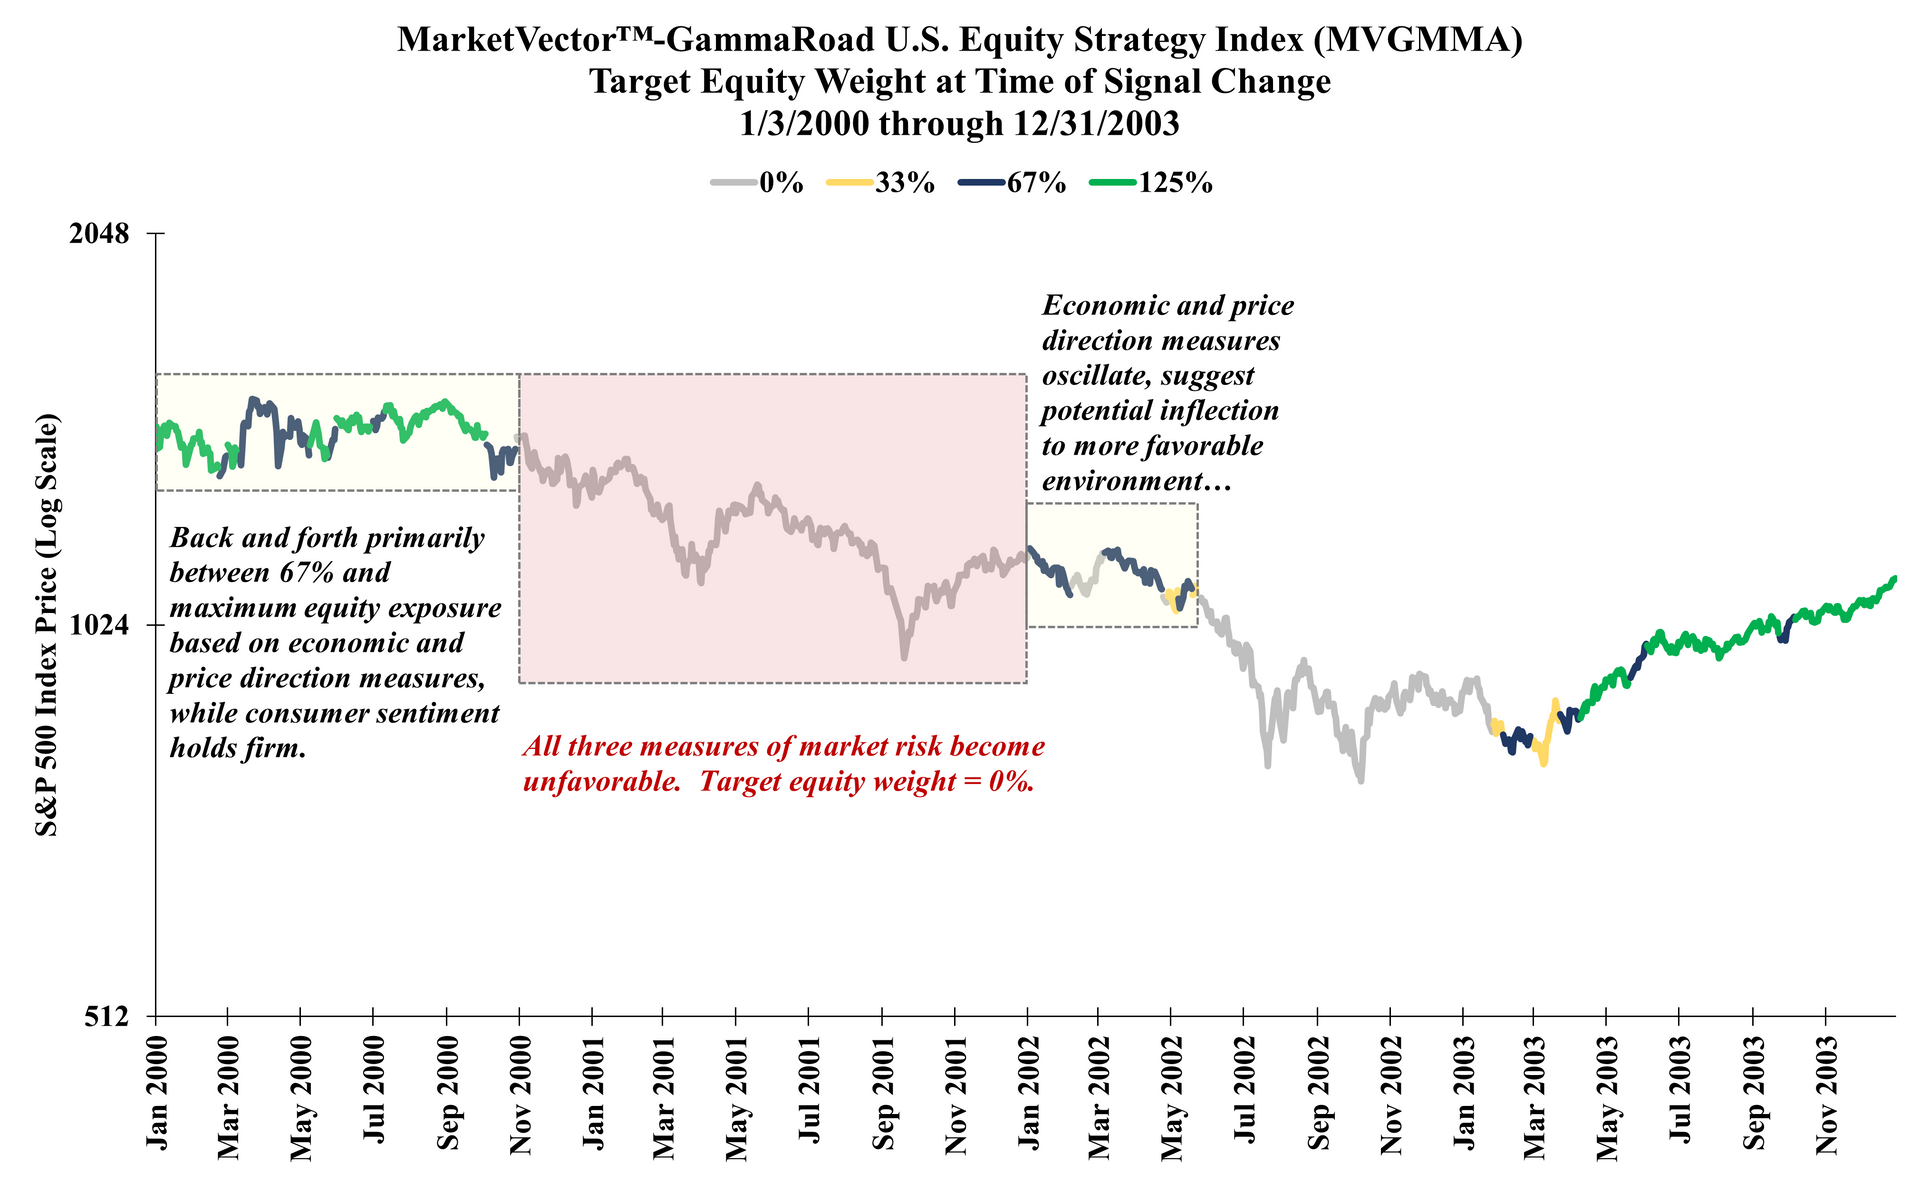
The months preceding major bear markets and significant drawdowns may begin with the strategy's equity weight at or near its maximum target exposure, and then the strategy can reduce exposure as each of our three drivers indicate a transition to less favorable conditions.
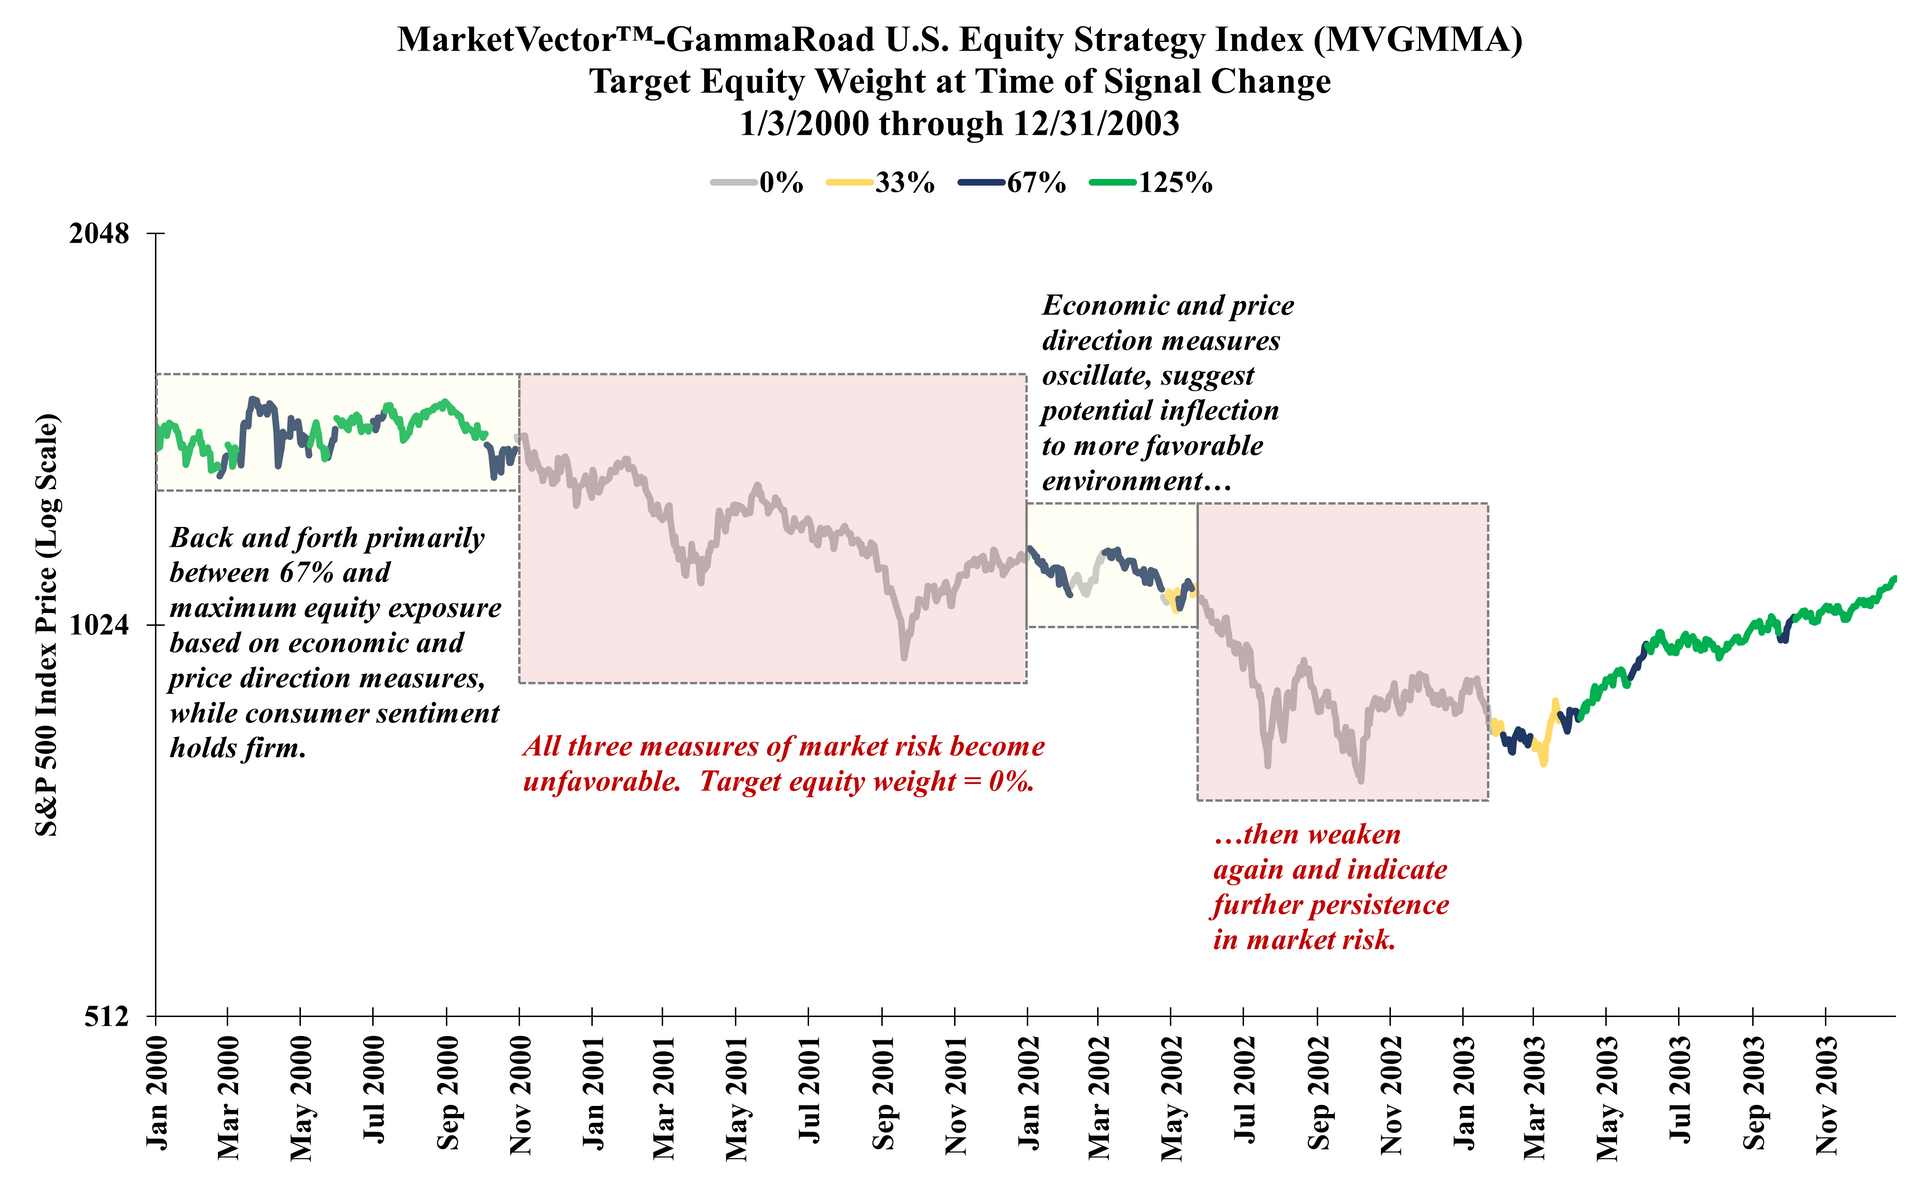
This adaptive process may often see some oscillation between target exposure levels as the system weighs the evidence. We find this to be intuitive: sometimes our measures may be capturing a significant change in market risk, while at other times these may turn out to be minor corrections within a larger bull market.
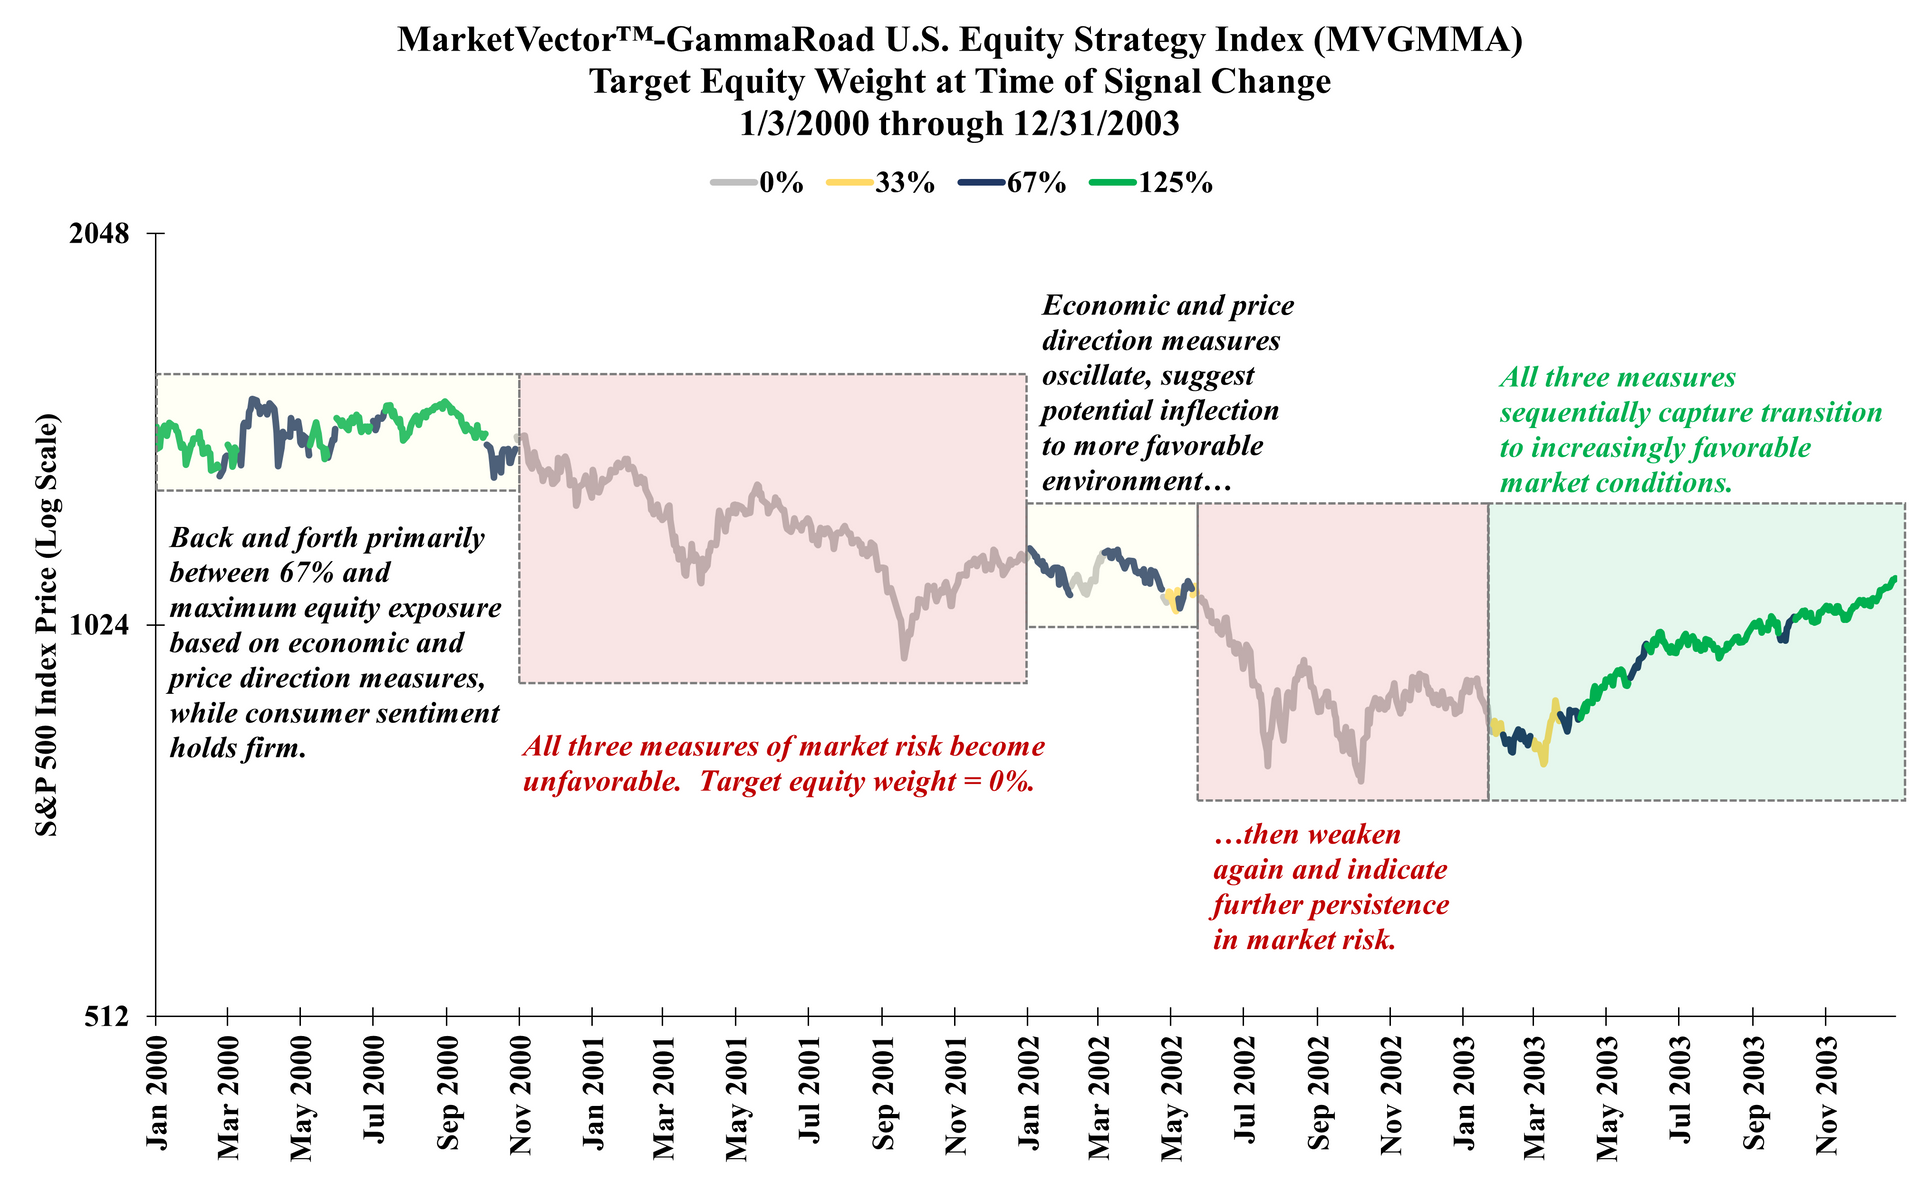
We also find that once our risk management process moves to its most conservative stance at 0% target equity weight, the system may be sending a clear signal about the potential persistence and magnitude of drawdown risk in the subsequent months.
Below are several examples that illustrate how the strategy’s exposure can evolve at major turning points.
Dot-Com Bubble
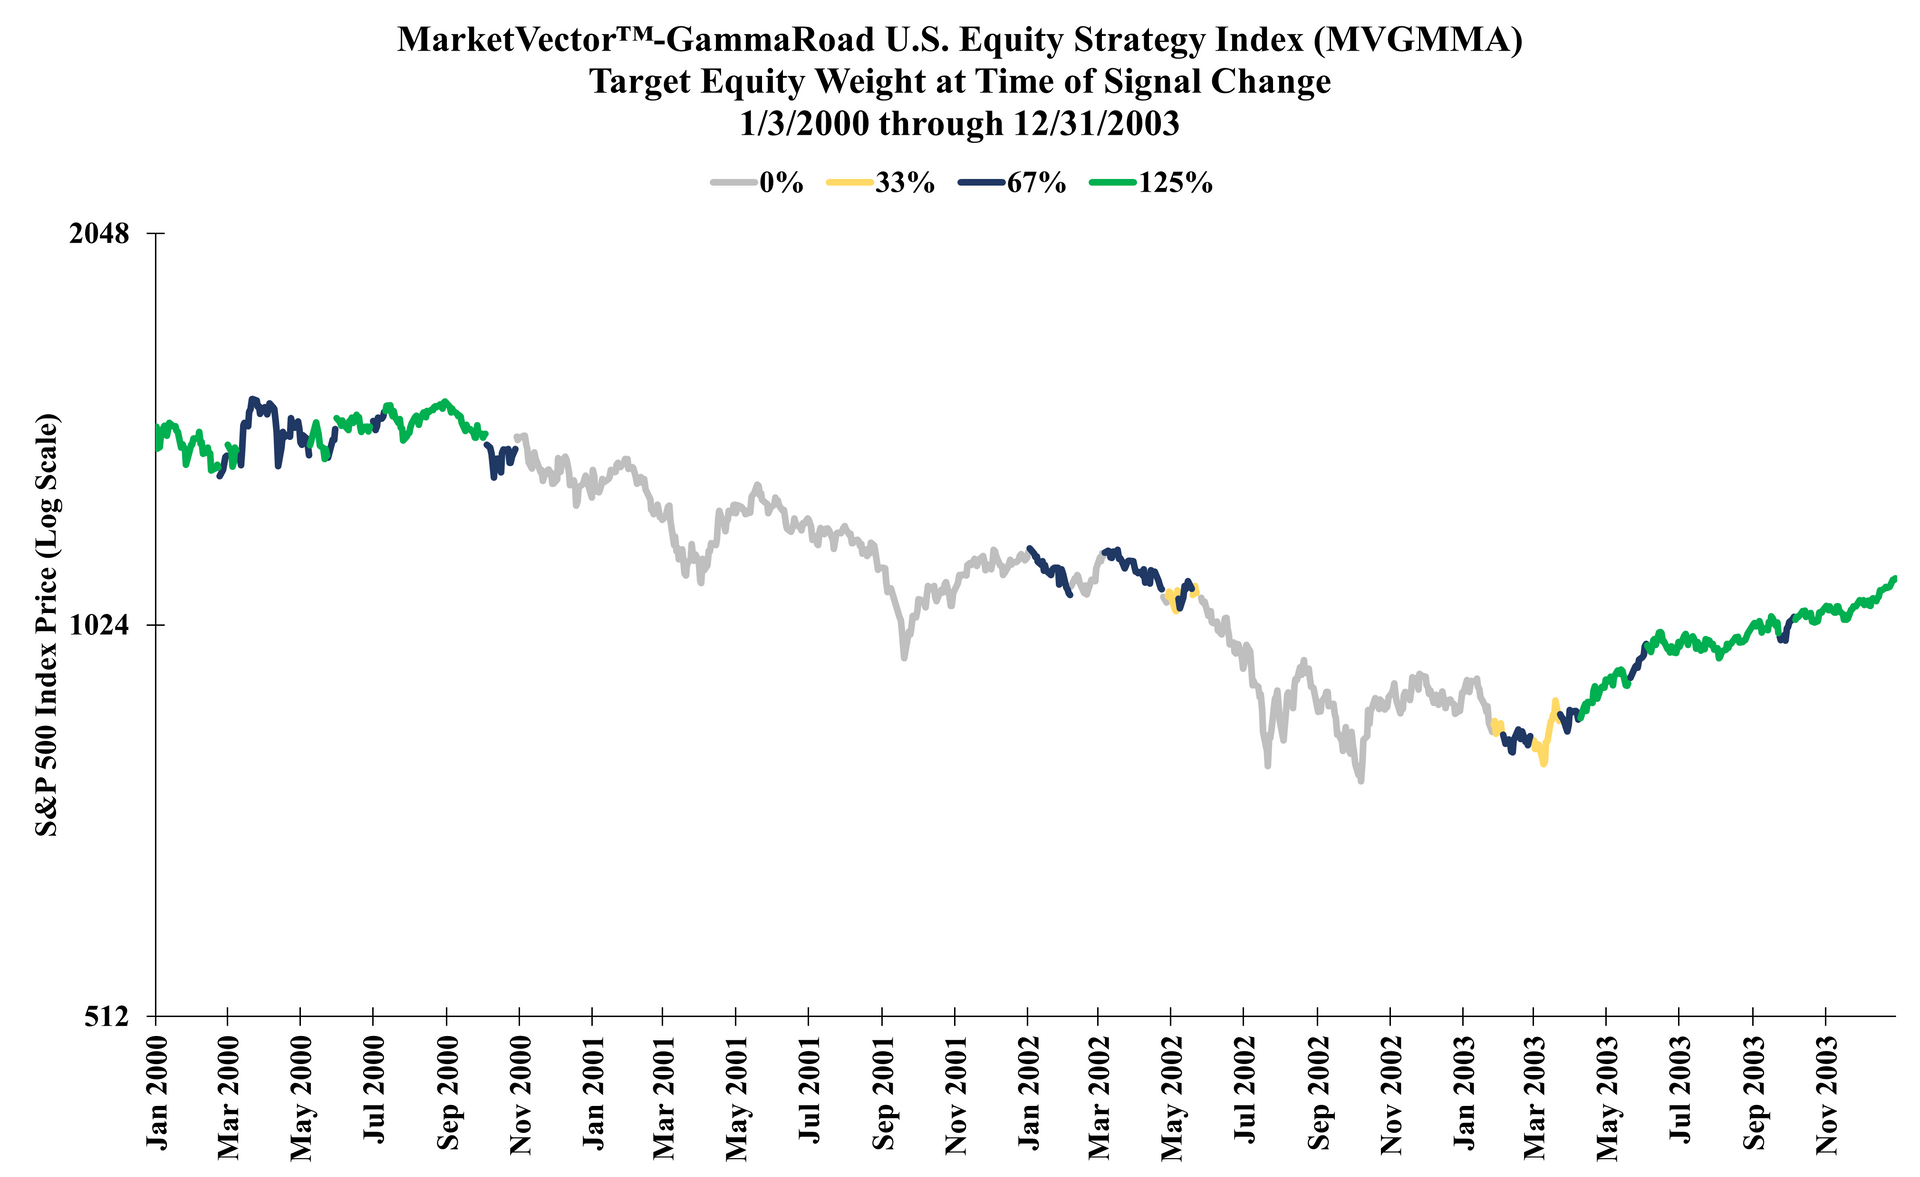
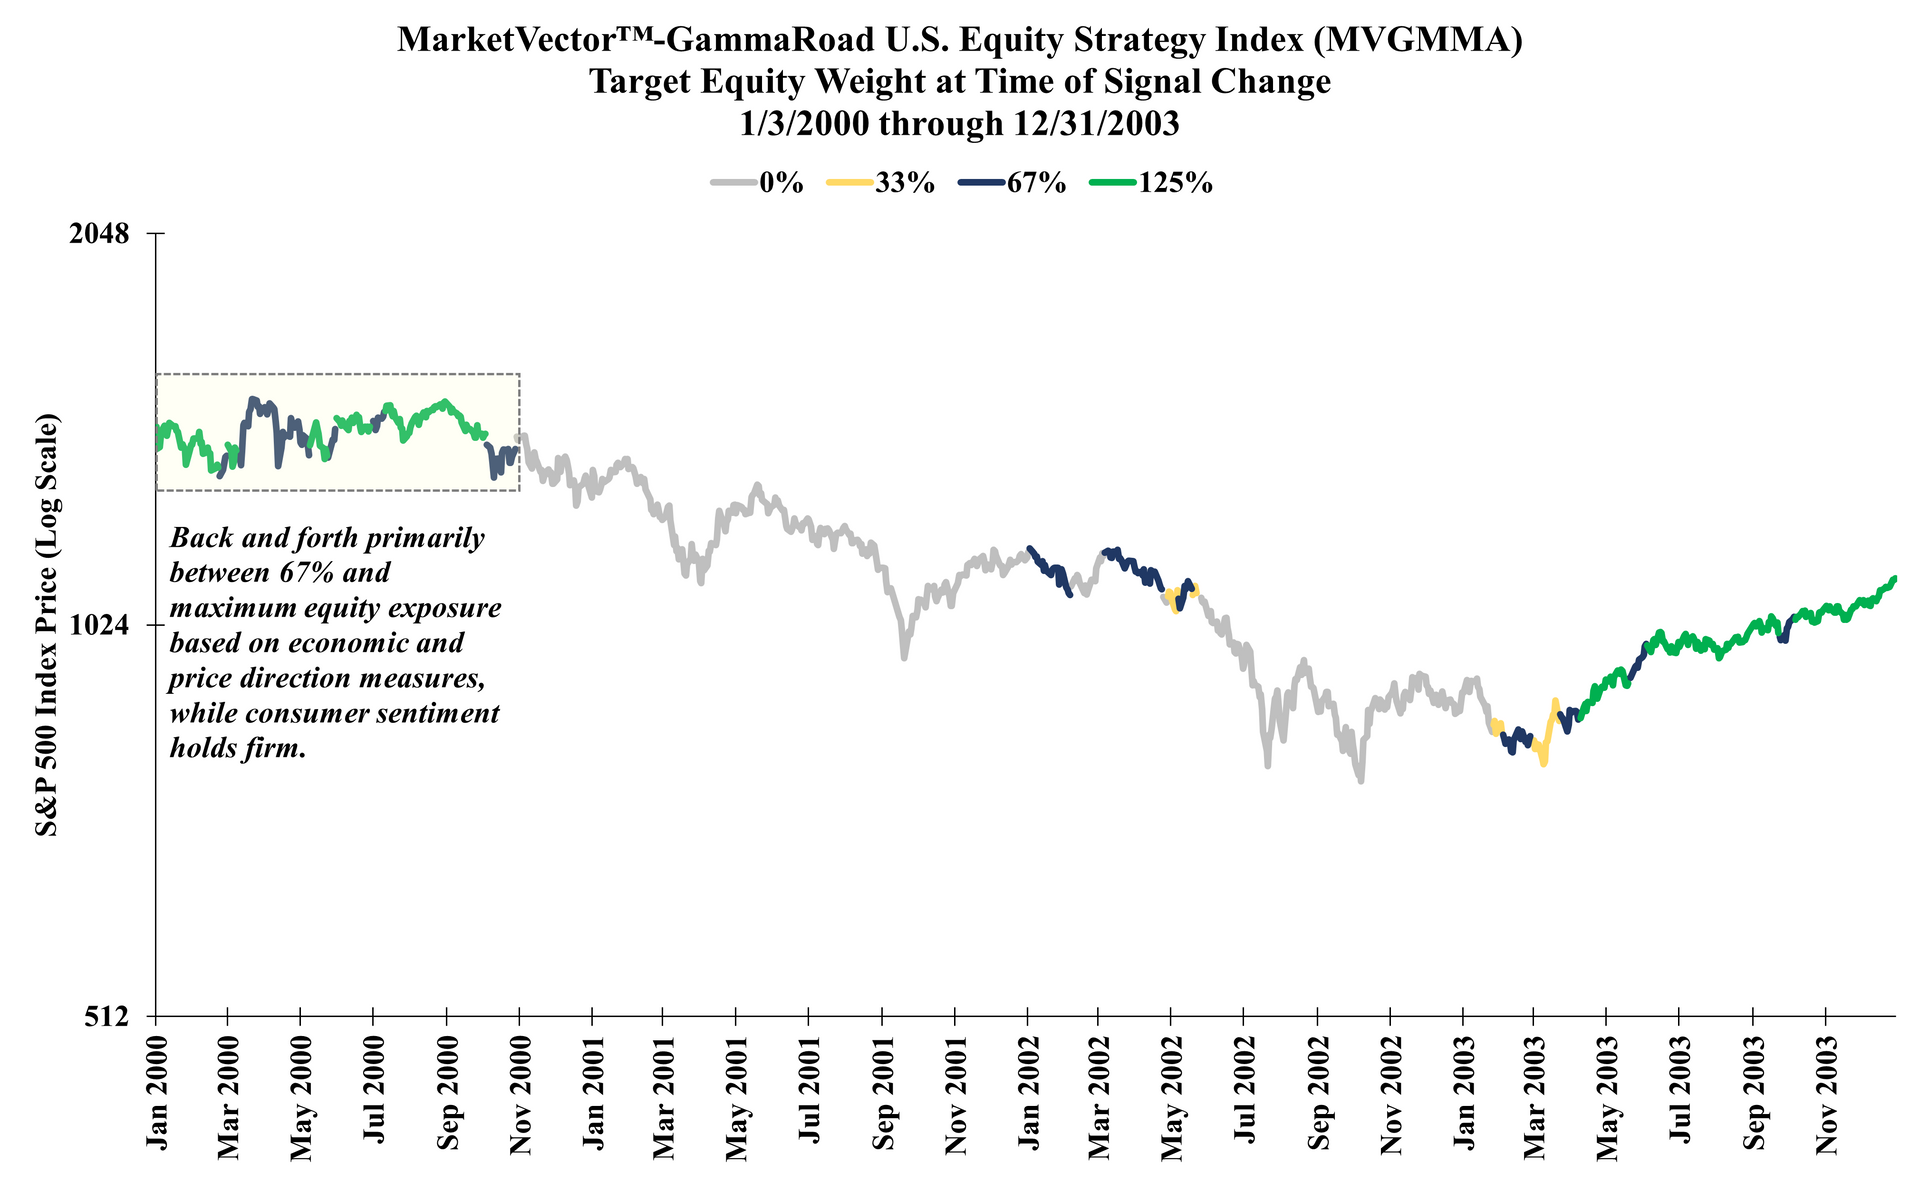
Source: GammaRoad Capital Partners, LLC. The S&P 500 Index is shown here on the y-axis to illustrate the index price level as the MarketVector™-GammaRoad U.S. Equity Strategy Index (Bloomberg: MVGMMA Index) target equity weight changes over time. The MVGMMA Index launched on December 22, 2023. Prior to December 22, 2023, the above target equity weight changes reflect backtested information based on the application of the MVGMMA Index methodology to the S&P 500 Index price data during periods when the MVGMMA Index was not actually published. Please see the important
disclosures that are integral to understanding the limitations applicable to the quantitative information in the presentation.
Global Financial Crisis
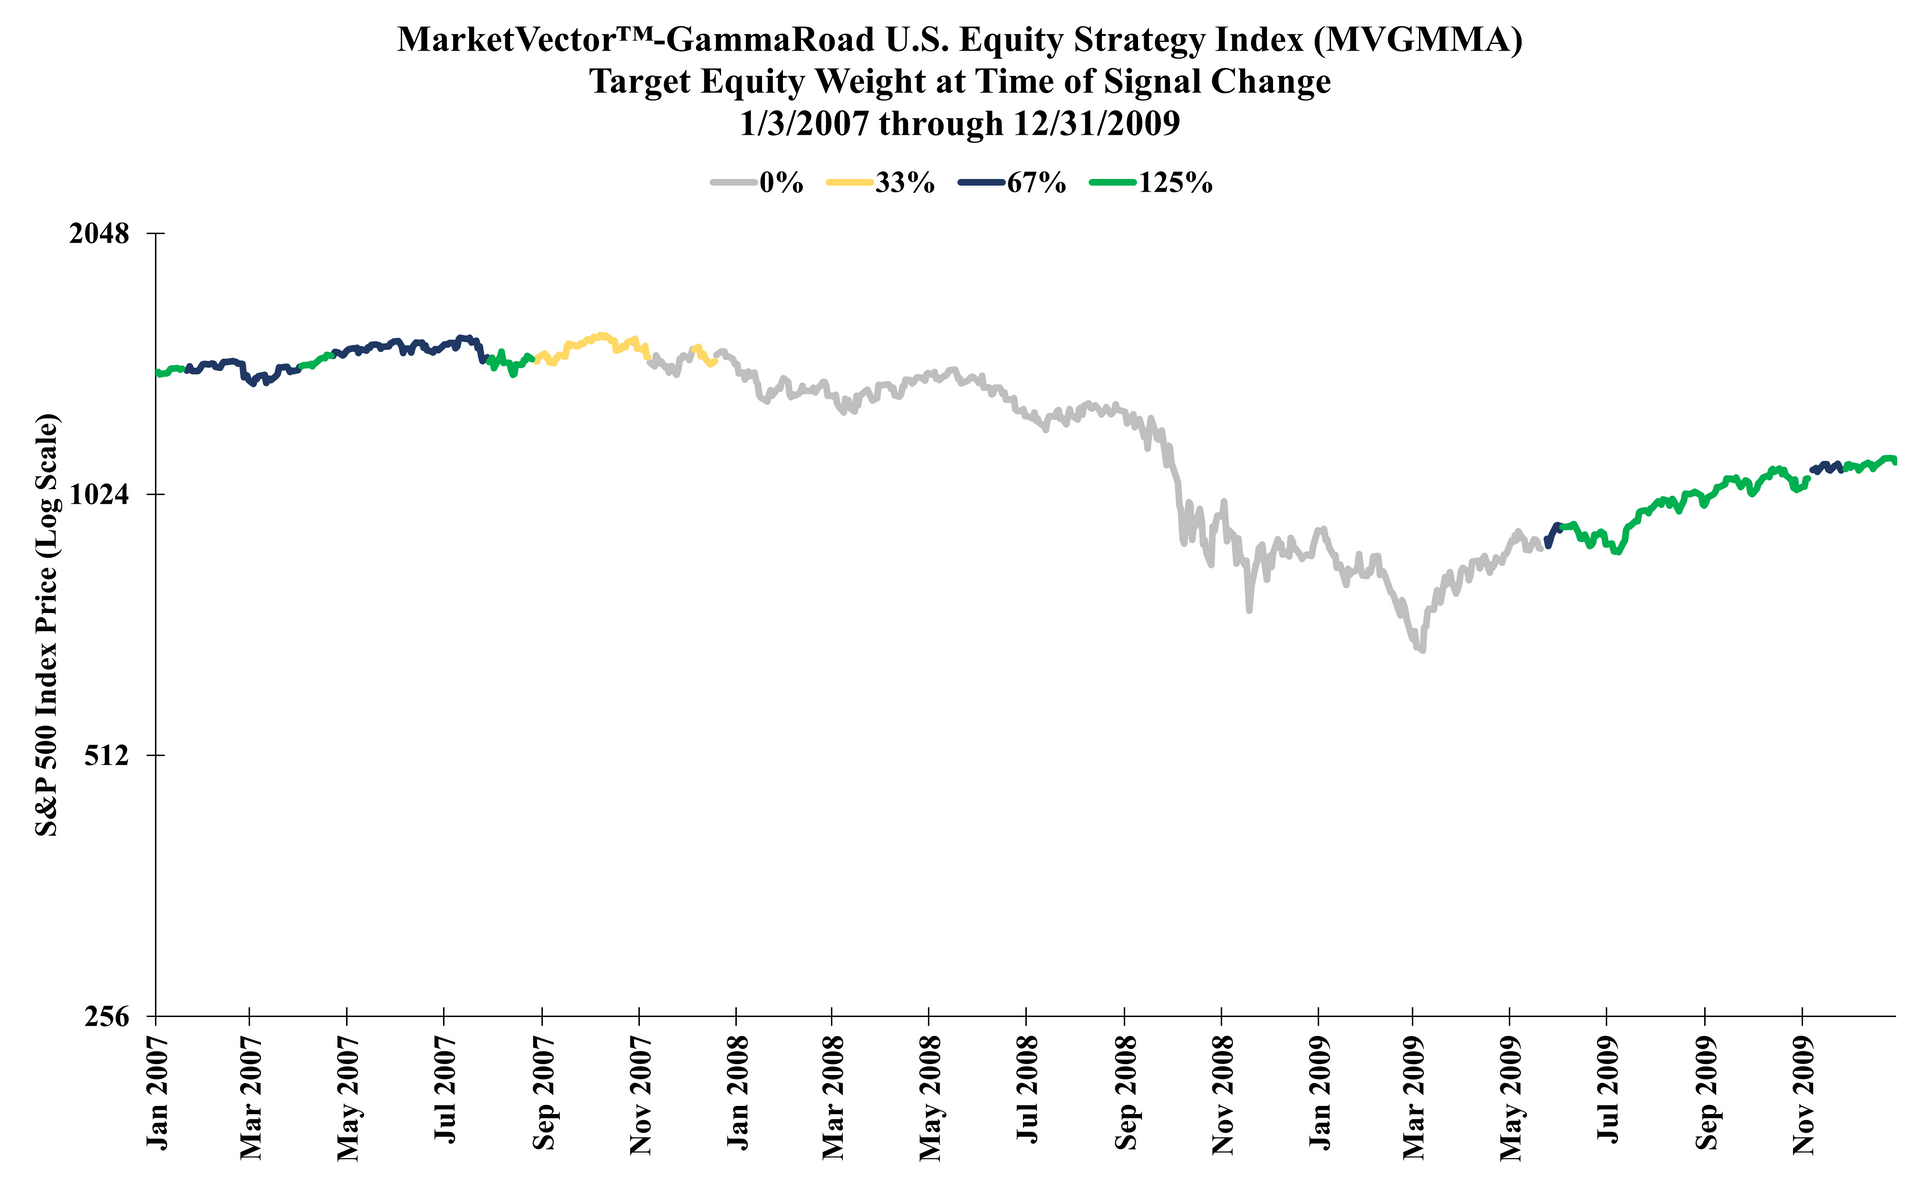
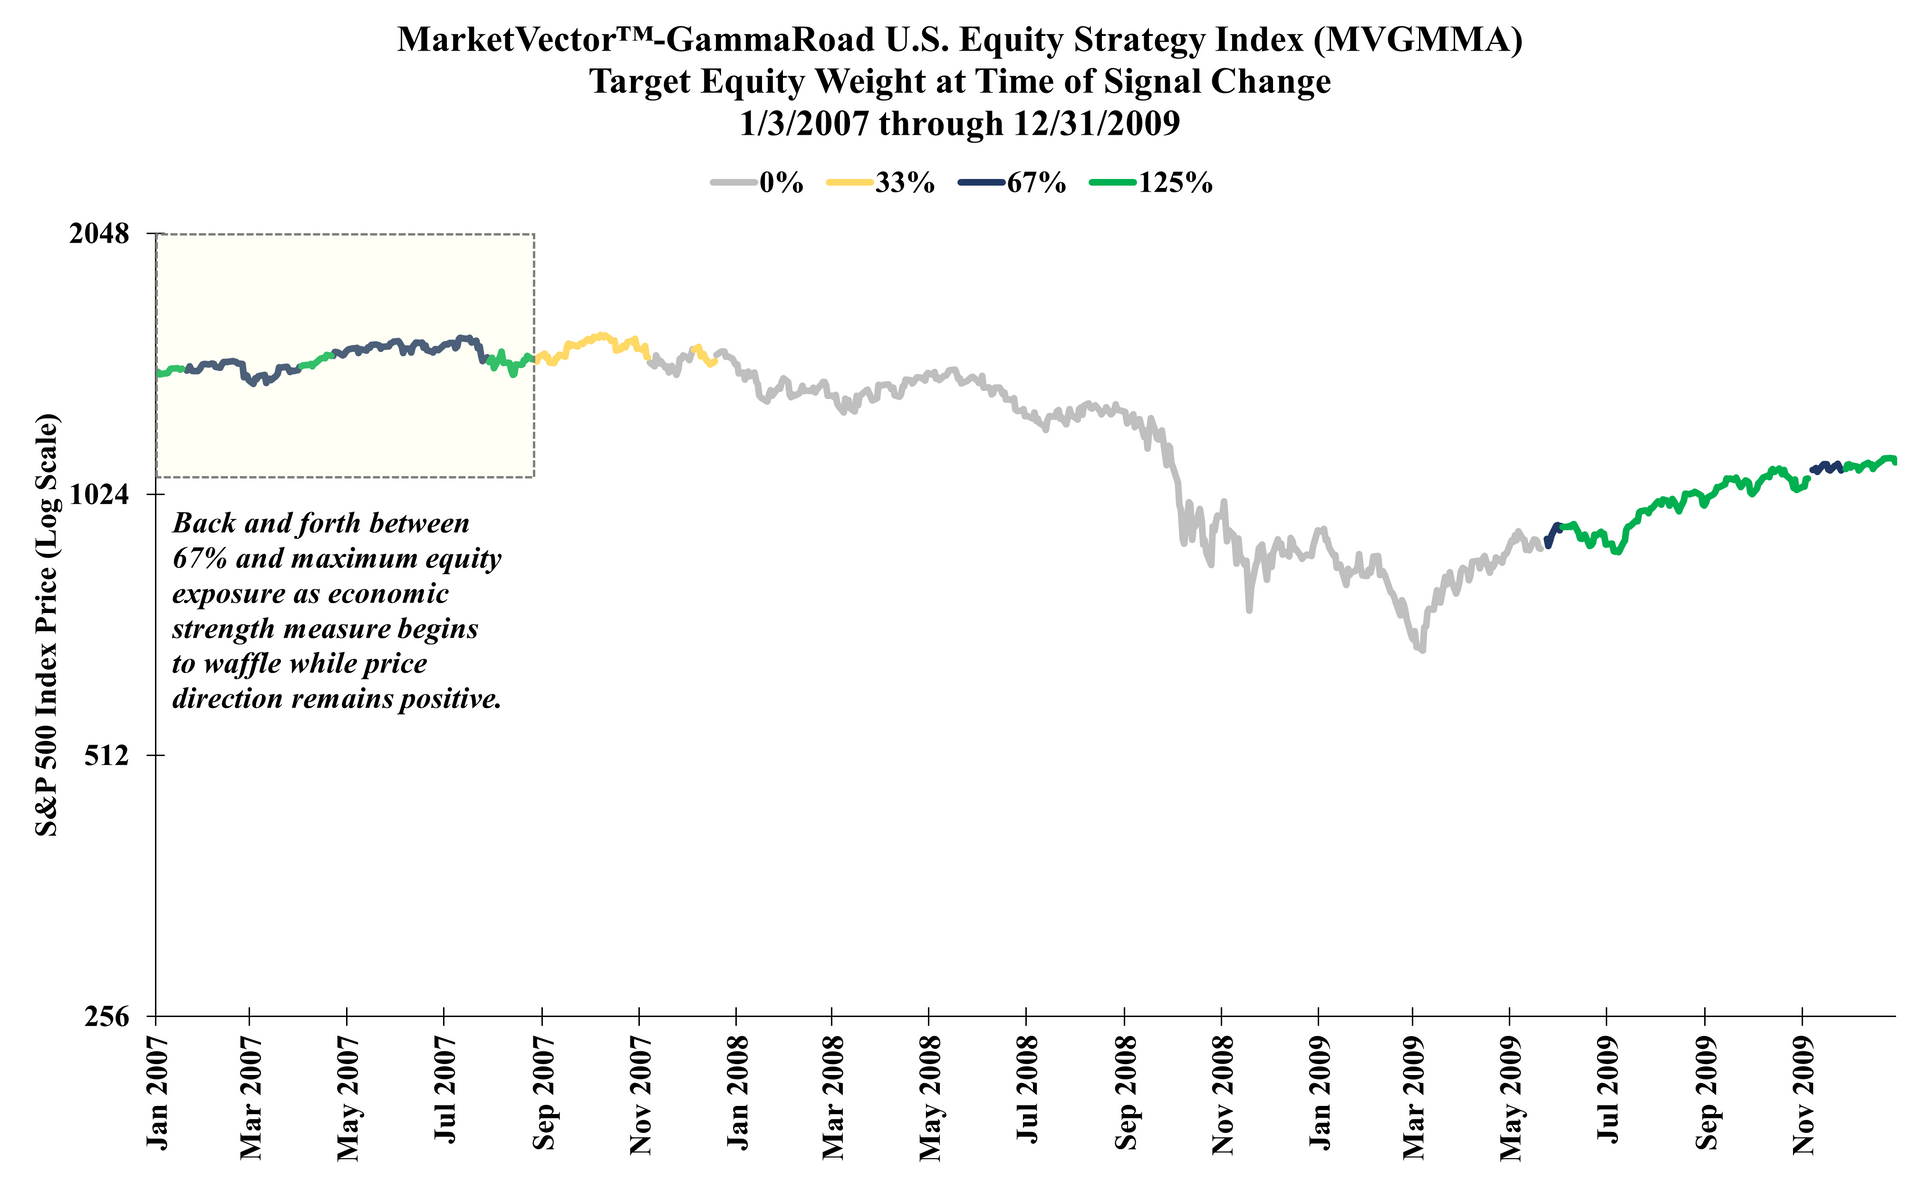
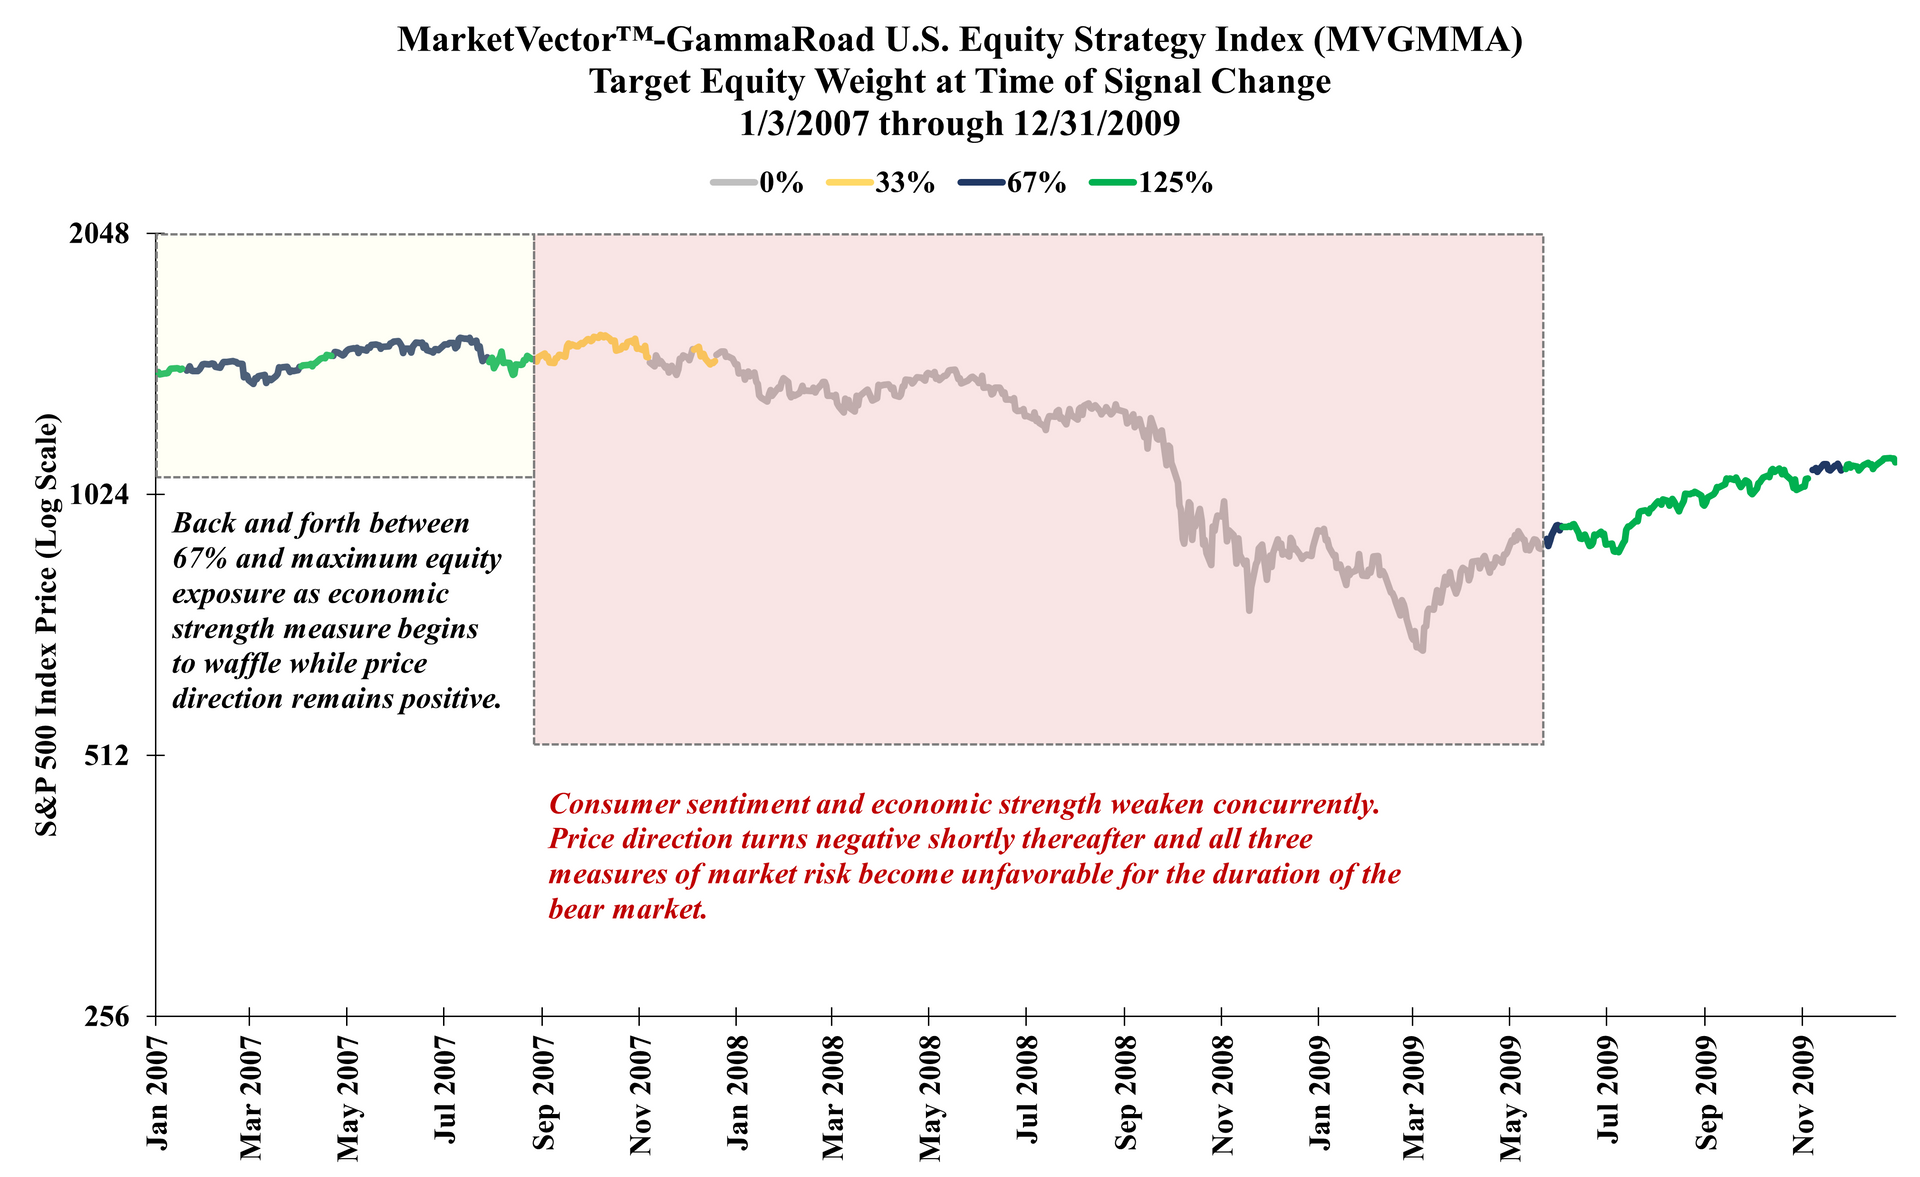
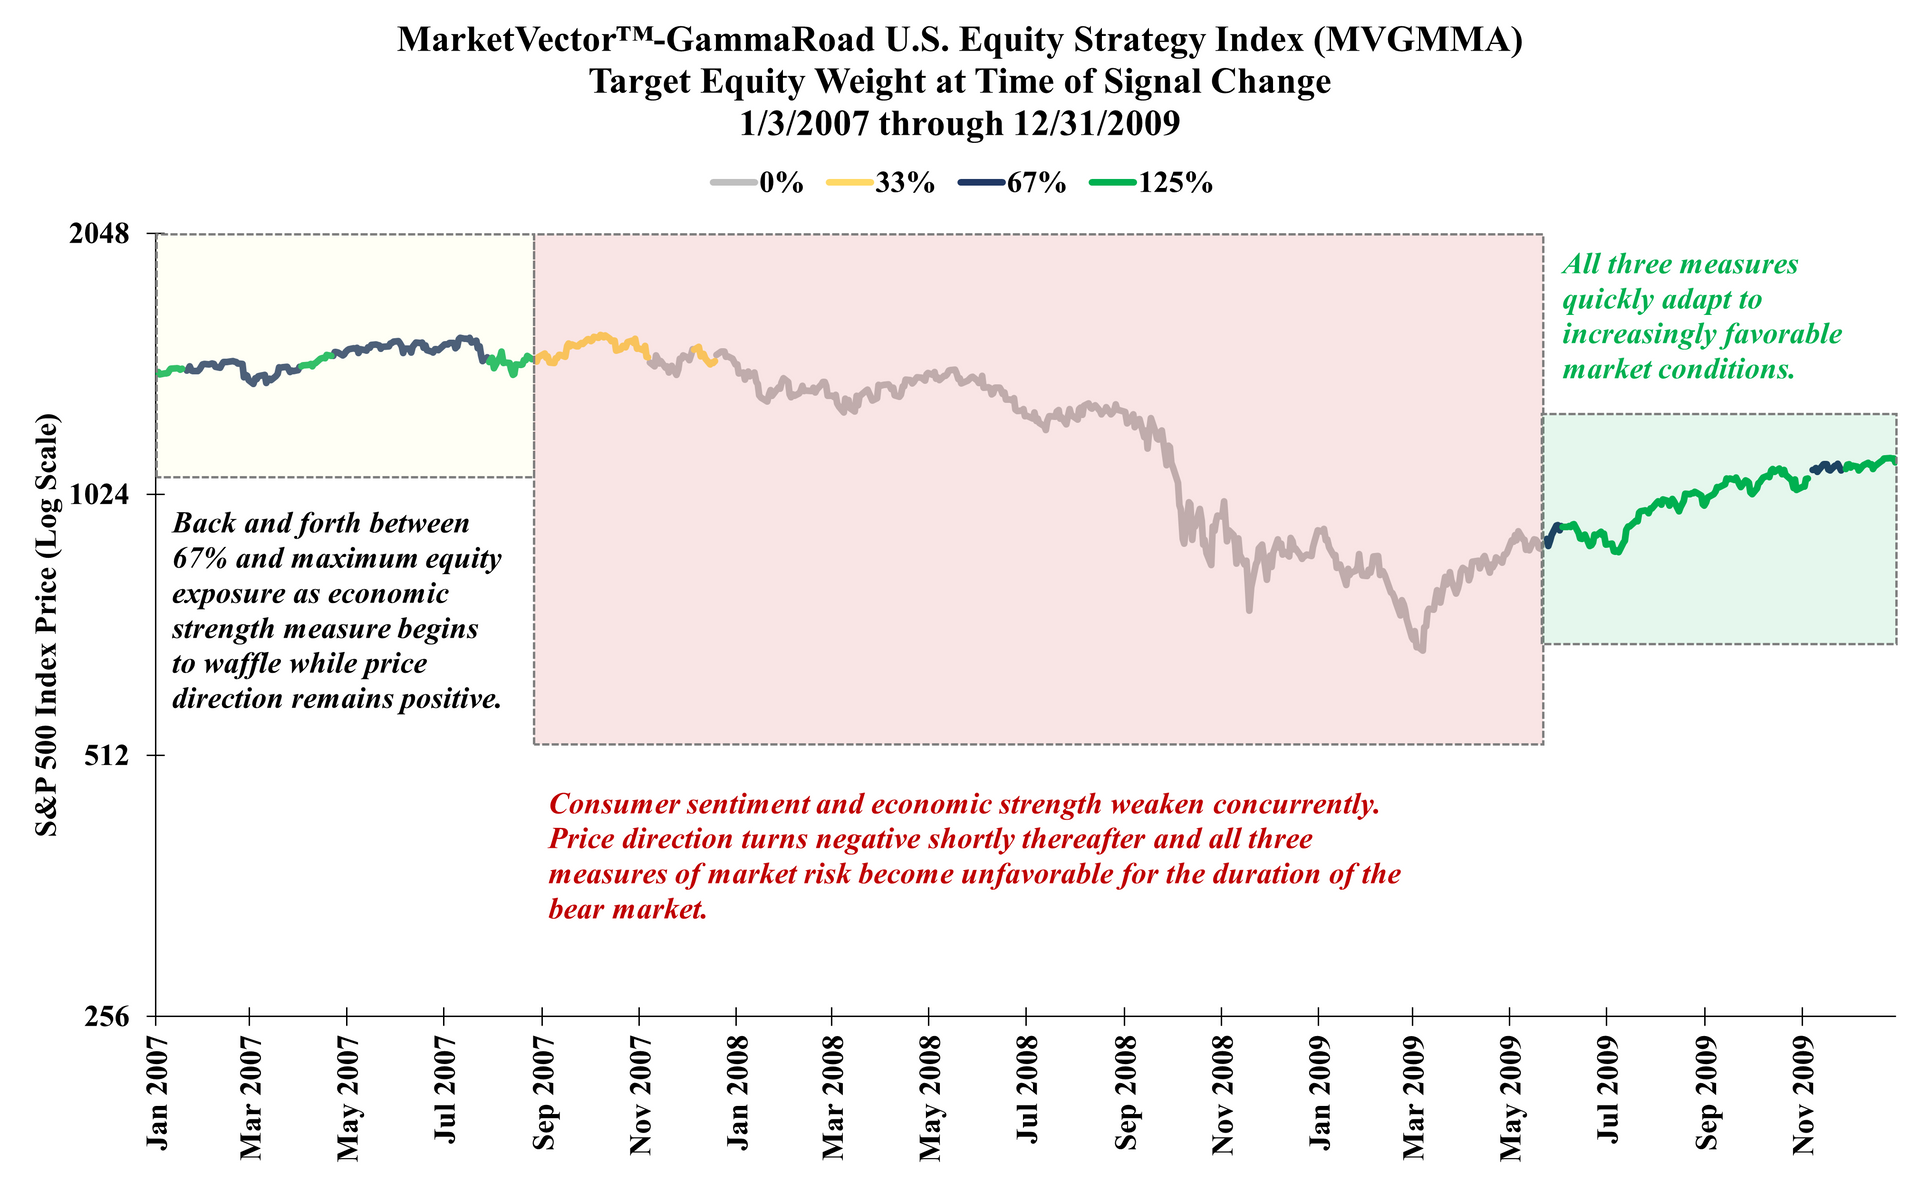
Source: GammaRoad Capital Partners, LLC. The S&P 500 Index is shown here on the y-axis to illustrate the index price level as the MarketVector™-GammaRoad U.S. Equity Strategy Index (Bloomberg: MVGMMA Index) target equity weight changes over time. The MVGMMA Index launched on December 22, 2023. Prior to December 22, 2023, the above target equity weight changes reflect backtested information based on the application of the MVGMMA Index methodology to the S&P 500 Index price data during periods when the MVGMMA Index was not actually published.
Please see the important
disclosures that are integral to understanding the limitations applicable to the quantitative information in the presentation.
Global Pandemic
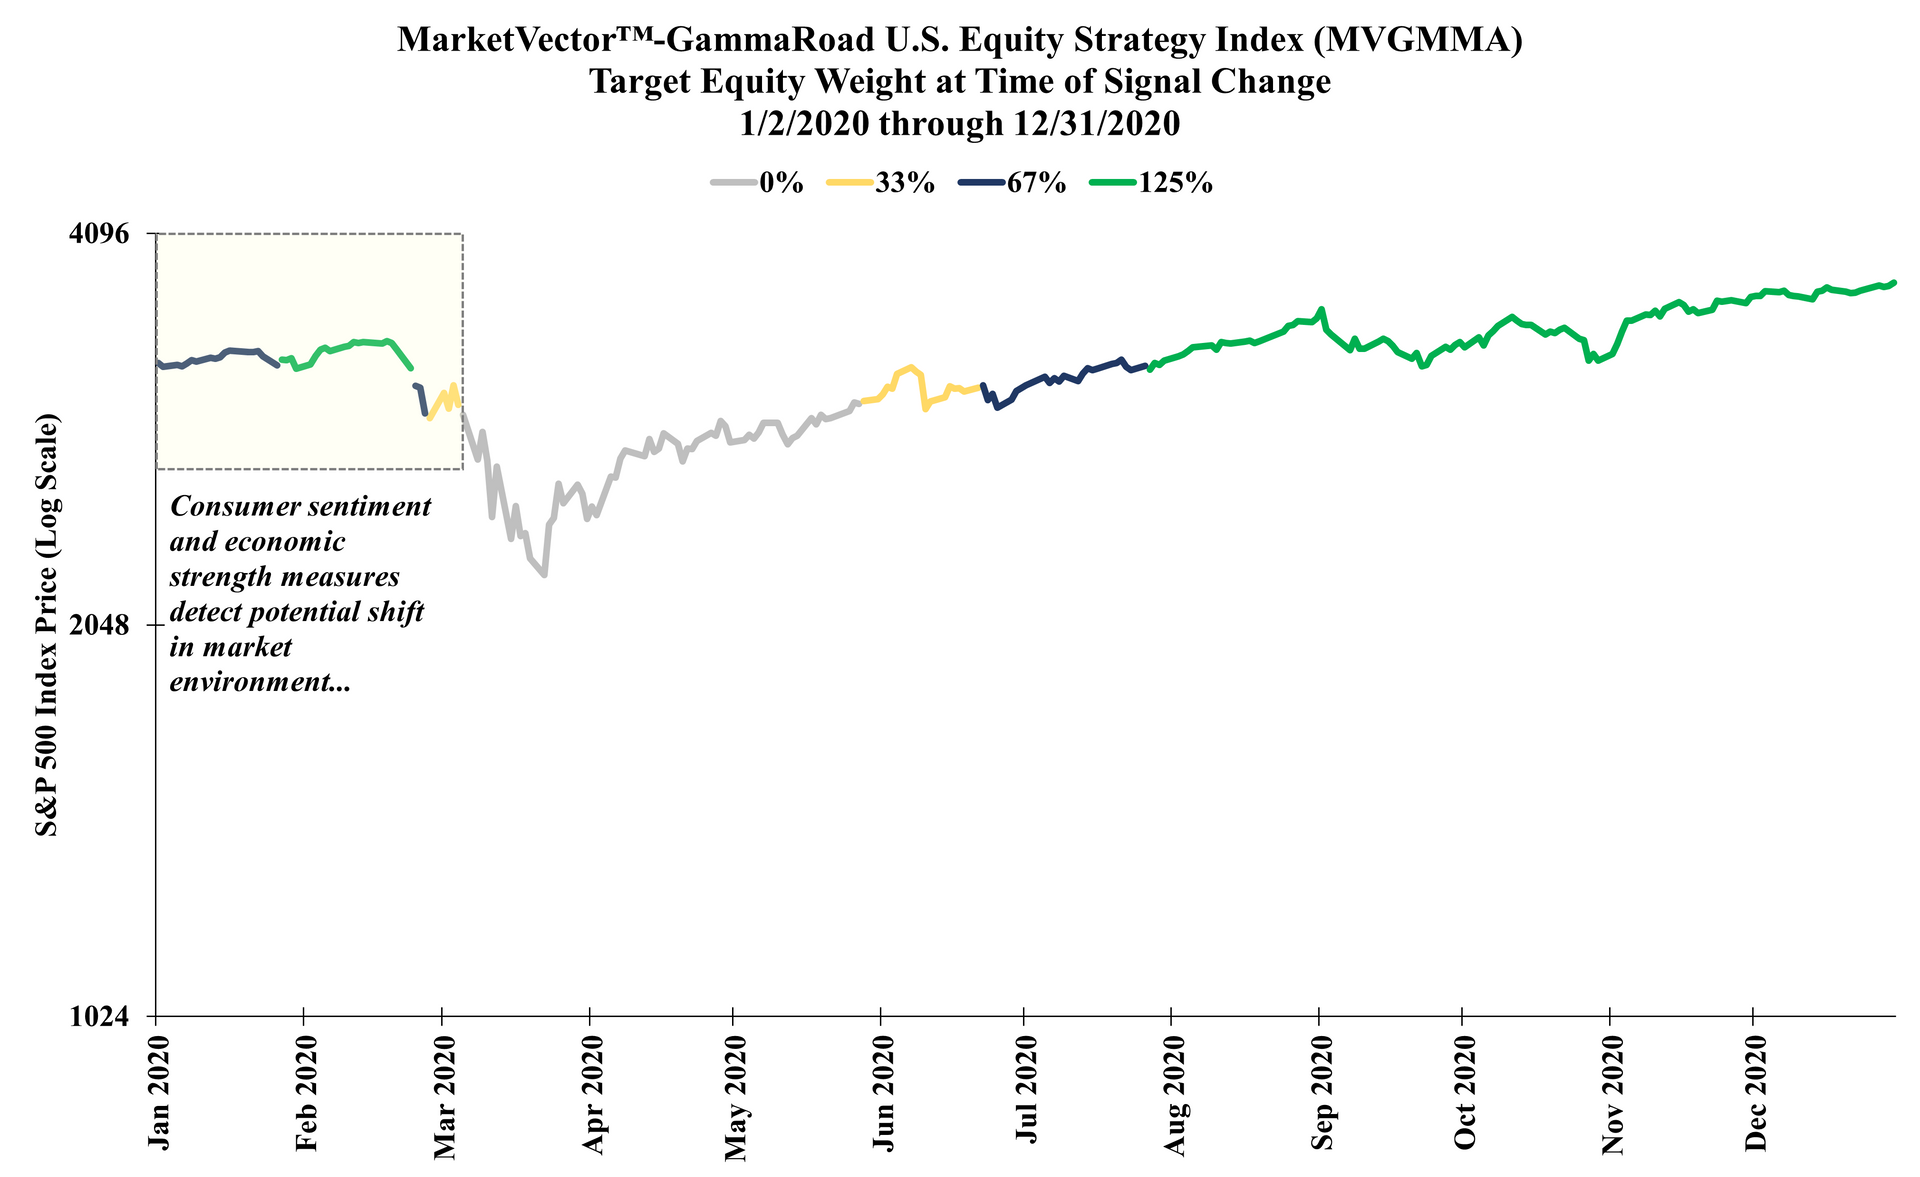
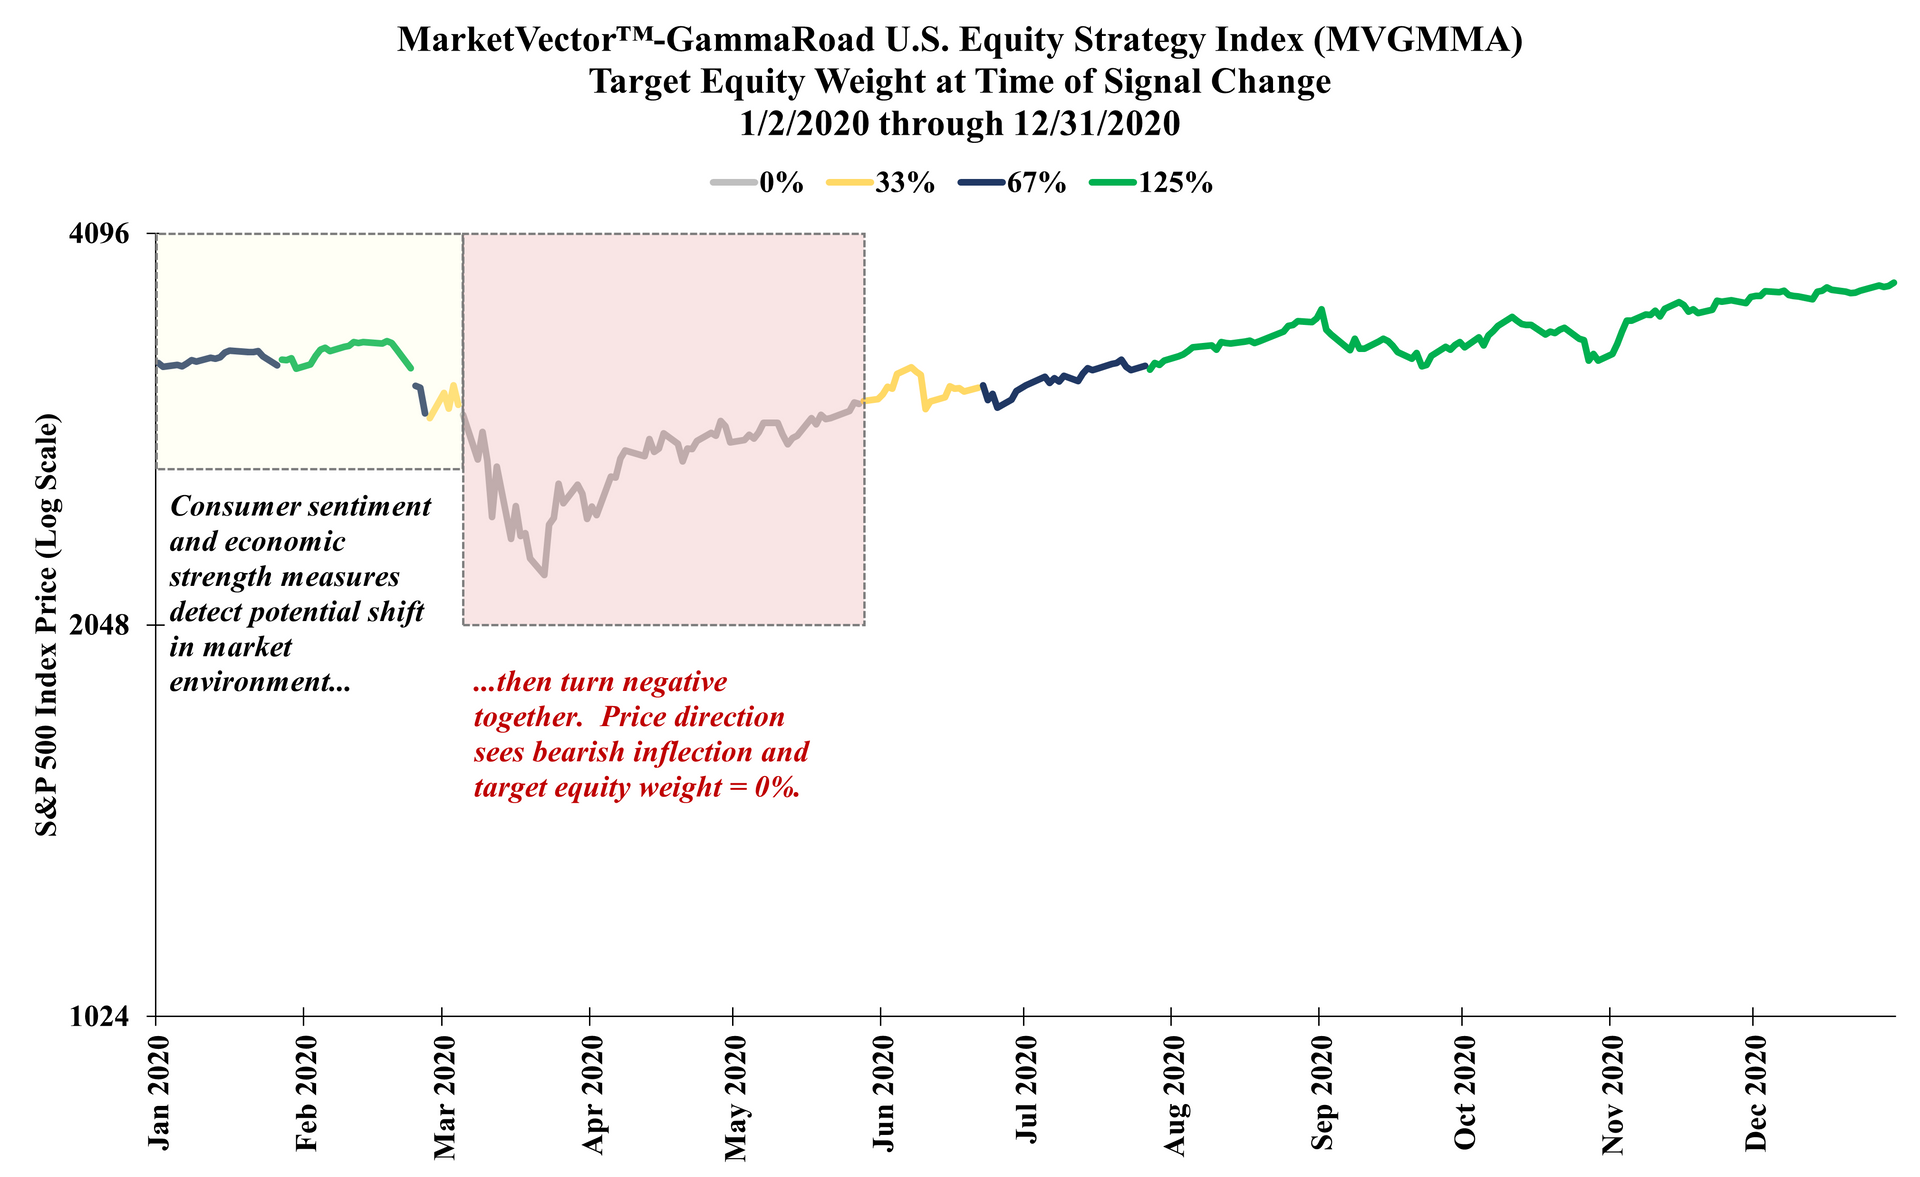
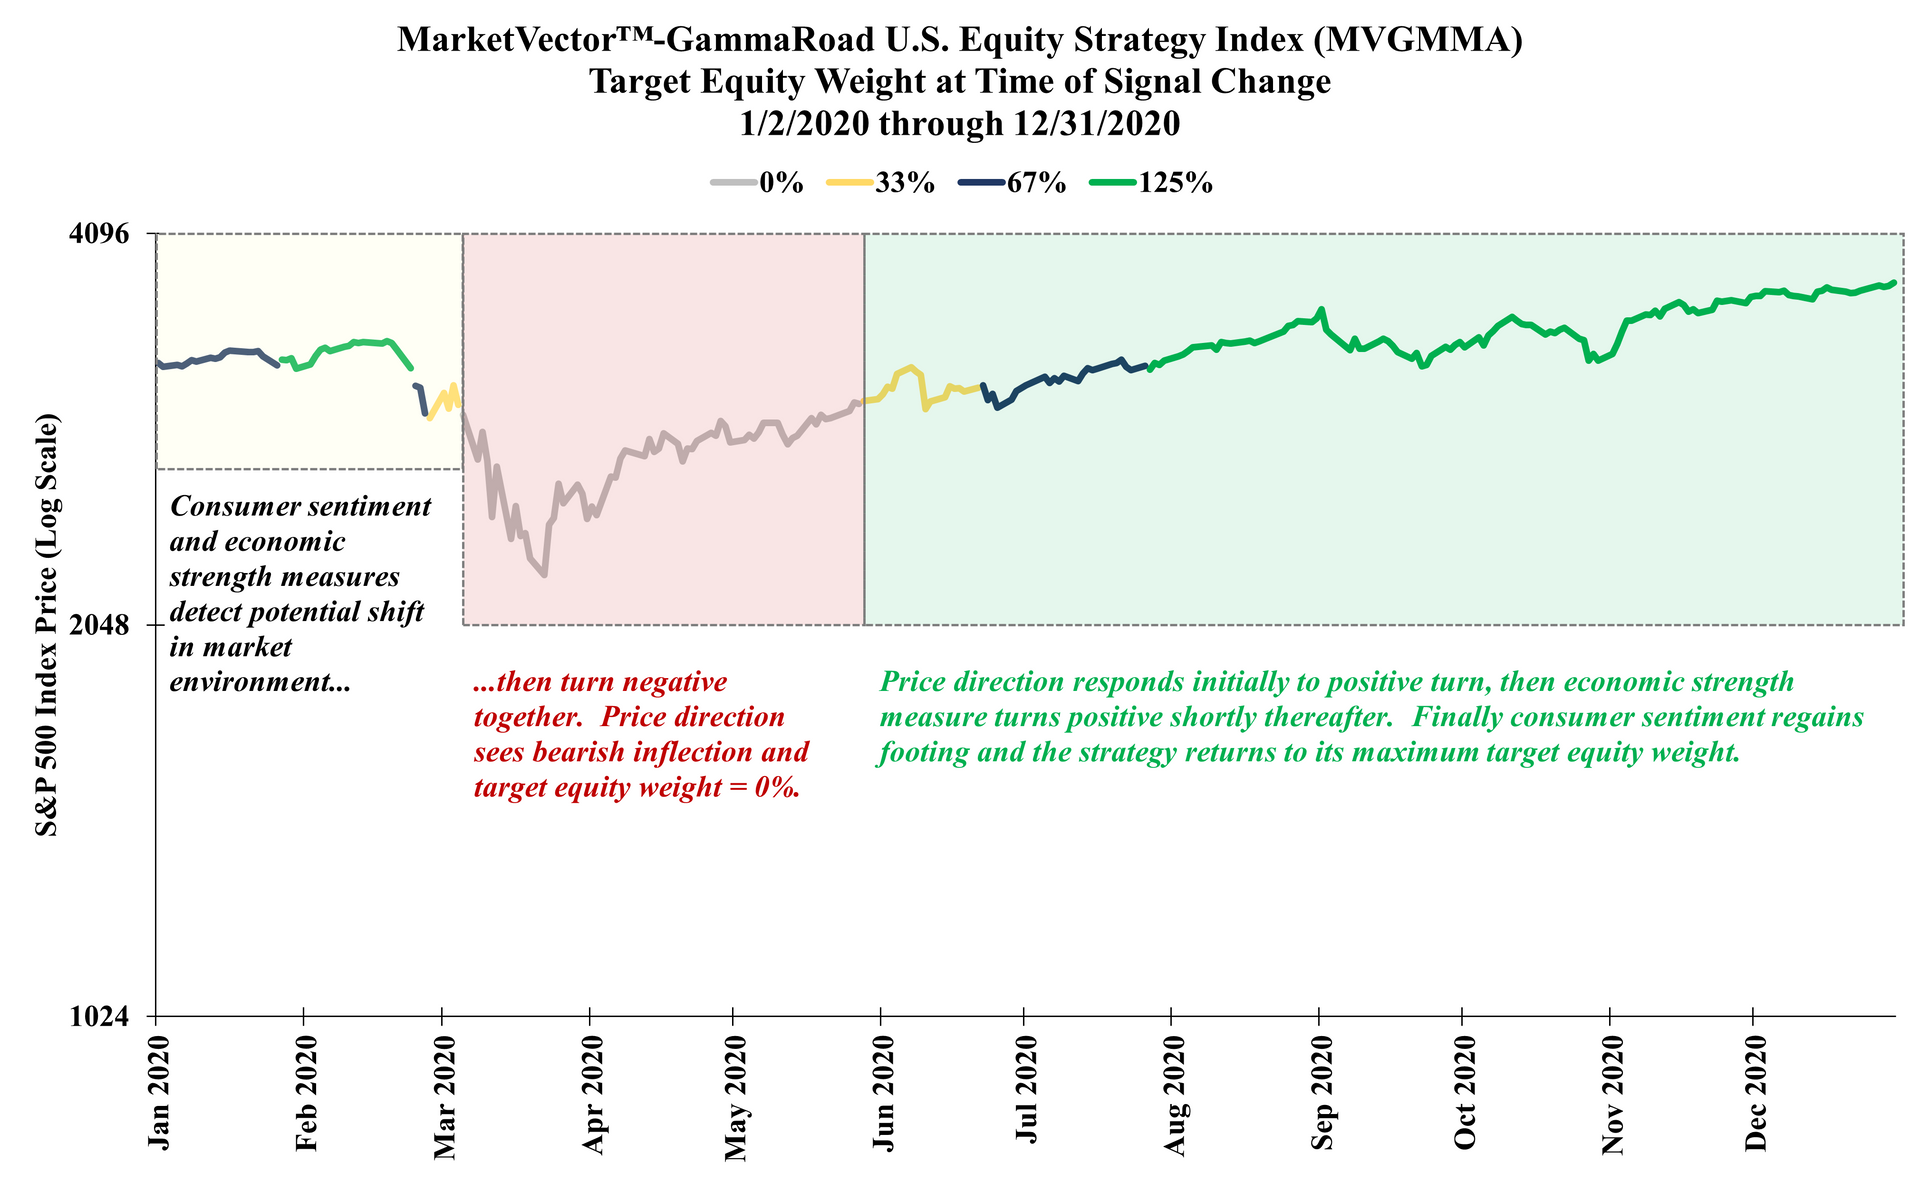
Source: GammaRoad Capital Partners, LLC. The S&P 500 Index is shown here on the y-axis to illustrate the index price level as the MarketVector™-GammaRoad U.S. Equity Strategy Index (Bloomberg: MVGMMA Index) target equity weight changes over time. The MVGMMA Index launched on December 22, 2023. Prior to December 22, 2023, the above target equity weight changes reflect backtested information based on the application of the MVGMMA Index methodology to the S&P 500 Index price data during periods when the MVGMMA Index was not actually published.
Please see the important
disclosures that are integral to understanding the limitations applicable to the quantitative information in the presentation.
Why Should This Work?
During our careers we have conducted research and due diligence on investment strategies across all major asset classes and styles. This work has included the review of numerous historical performance tests of systematic, rules-based strategies.
As a result, we have developed a keen understanding and awareness of the potential shortcomings that accompany historical performance tests.
We believe any historical test should be approached with a healthy degree of skepticism and examined with several crucial questions in mind:
- Why does this strategy appear to work in the past?
- Why should we expect this strategy to work in the future?
- What makes the strategy robust or fragile?
We have purposefully focused on incorporating these lessons into our research and strategy development to arrive at our architecture.
Why We Expect Our System to Work in the Future
Intuitive Drivers of Performance
Any systematic investment process should be supported by an underlying rationale for what drives its expected risk and return. We view our chosen drivers as highly intuitive and complementary to each other, which in turn makes their combination diversifying and robust in nature.
- Consumer sentiment should be a primary influence on economic activity, risk appetite, and market conditions.
- The performance of assets that benefit from cyclical expansion (lumber, copper) relative to an asset that benefits from risk aversion and uncertainty (gold) should be indicative of risk appetite and market direction.
- Price direction of the market itself should provide a valuable signal for the aggregated views of all market participants on the expected favorability of the market environment.
Adaptive Measurement Methods = Adaptive Responses to Change
To ensure that the strategy employs intuitive drivers is only part of the path to expected reliability. Once we establish the underlying rationale for each market influence, the way we actually measure those influences will determine how effectively the strategy can respond to potential changes in market risk.
We have engineered our measurements based on principles we believe have strong signal-to-noise characteristics and are therefore expected to be more reliable. Specifically, we combine the concepts of rate-of-change and phase transition when measuring each market influence.
An analogy for how and why we utilize rate-of-change is measuring a car’s speed versus its velocity plus acceleration. Speed alone will simply indicate how fast the car is moving, whereas the combination of velocity and acceleration will provide valuable information about the car’s inertia.
While markets are driven by human behavior and do not follow the hard and fast rules that govern the physical world, we believe the concept of phase transition from chemistry certainly applies to measuring market conditions. Just as the properties of water cause it to change state when subjected to inflections in temperature and pressure, we observe that market risk can materially change state at inflection points in the influences we measure.
Driven by Consistent Response Function Rather than an Optimization Process
Human nature compels us to find the single best result and then follow that path going forward. Many systems and market models are designed to employ what has been the optimal choice of variables and thresholds during a particular event or time period.
We find that the more a strategy is designed to navigate one particular time period or market environment, the less likely it will display the same strength in a different scenario.
We apply this lesson from our experience to the strategy’s risk allocation process. We intentionally assign an equal weight to each of our market drivers in the overall scoring process. Just because one measure may have worked better than another in the past, we may see a completely different ranking in the future. We employ equal weights to ensure that we do not have any disproportionate dependence on any driver’s historical behavior.
Like everything else in markets, this choice to prioritize robustness over optimal values presents important trade-offs. While we expect meaningful outperformance during larger market drawdowns, we also expect periodic underperformance during calmer environments. Fortunately, the math of compound growth supports our approach to achieving long-term market returns primarily by avoiding the riskiest periods.
What We Believe Makes Our System Robust
Minimal Degrees of Freedom (Number of Inputs/Variables)
We have observed that systematic strategies, whether predictive or reactive, tend to see their efficacy weaken as the number of inputs or variables increases. We have intentionally limited the number of data inputs and parameter values to what we view as a minimalist approach. This goes hand-in-hand with our avoidance of optimization and overfitting our rules to any single event or time period.
Objective, Time-Tested Inputs Only
We utilize market prices and a single survey-based index value as the only inputs throughout the strategy.
Parameter Stability
We have found that an excellent way to gauge a systematic strategy’s durability is to vary each parameter value in small increments and look for stability and consistency in the historical test results.
For example, when measuring over a 100-day period, one should be able to vary that length in either direction (e.g. 92, 94, 96, 98, 100, 102, 104, 106, 108) and see only a marginal change in the overall performance metrics and behavior of the strategy. If the test results change meaningfully with only minor incremental changes in the variable, then this suggests an undesirable degree of fragility going forward.
This condition is a prerequisite for our system design and the strategy's expected durability. We have extensively tested our rules by varying our chosen time horizons and thresholds in small increments to establish our confidence in the robustness of our approach.